Fig. 1
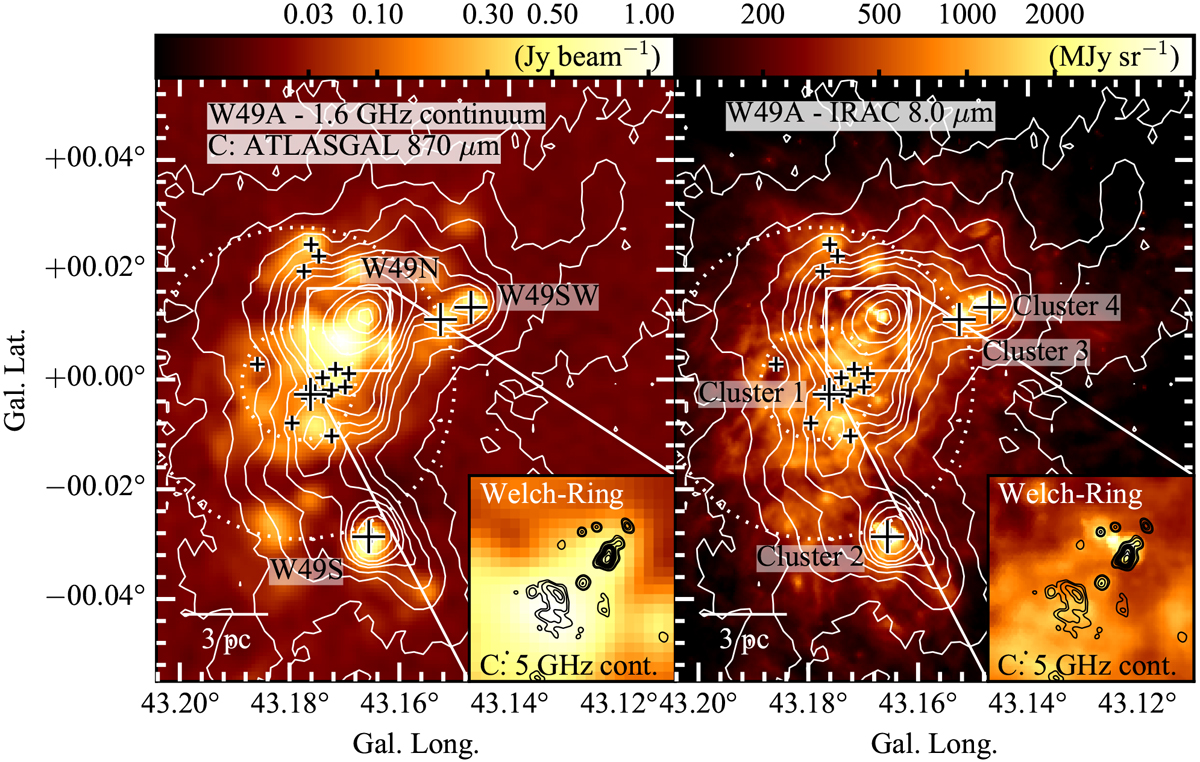
Overview of W49A in 1.6 GHz continuum emission (in color scale on the left panel; THOR; Wang et al. 2018) and GLIMPSE Spitzer IRAC 8.0 μm emission (right panel; Benjamin et al. 2003; Churchwell et al. 2009). White contours indicate cold, dense dust in 870 μm emission (ATLASGAL, Schuller et al. 2009; at levels of −0.24, 0.24, 0.8, 1.6, 2.4, 3.2, 4.0, 5.2, 8.0,16.0, 24.0, 40.0, 56.0 Jy beam−1). Large crosses indicate stellar clusters found with JHK imaging (Alves & Homeier 2003) while small crosses indicate individual O stars observed by Wu et al. (2016). The insert shows the Welch-Ring of ultra-compact H II regions (UC H II regions, Welch et al. 1987), represented here by contours of 5 GHz continuum emission (CORNISH survey, Hoare et al. 2012; at levels of 0.01, 0.02, 0.05, 0.75, 0.1, 0.125, 0.15, 0.175, 0.2, 0.25 Jy beam−1). The dotted inner ring indicates the shell structure found in this work (in good agreement with shells found by Peng et al. 2010); the outer ring indicates the approximate size of W49A. Labels in the left panel indicate main cm-continuum emission peaks (e.g., Dreher et al. 1984) and in the right panel indicate infrared star clusters (Alves & Homeier 2003).
Current usage metrics show cumulative count of Article Views (full-text article views including HTML views, PDF and ePub downloads, according to the available data) and Abstracts Views on Vision4Press platform.
Data correspond to usage on the plateform after 2015. The current usage metrics is available 48-96 hours after online publication and is updated daily on week days.
Initial download of the metrics may take a while.