Fig. 2
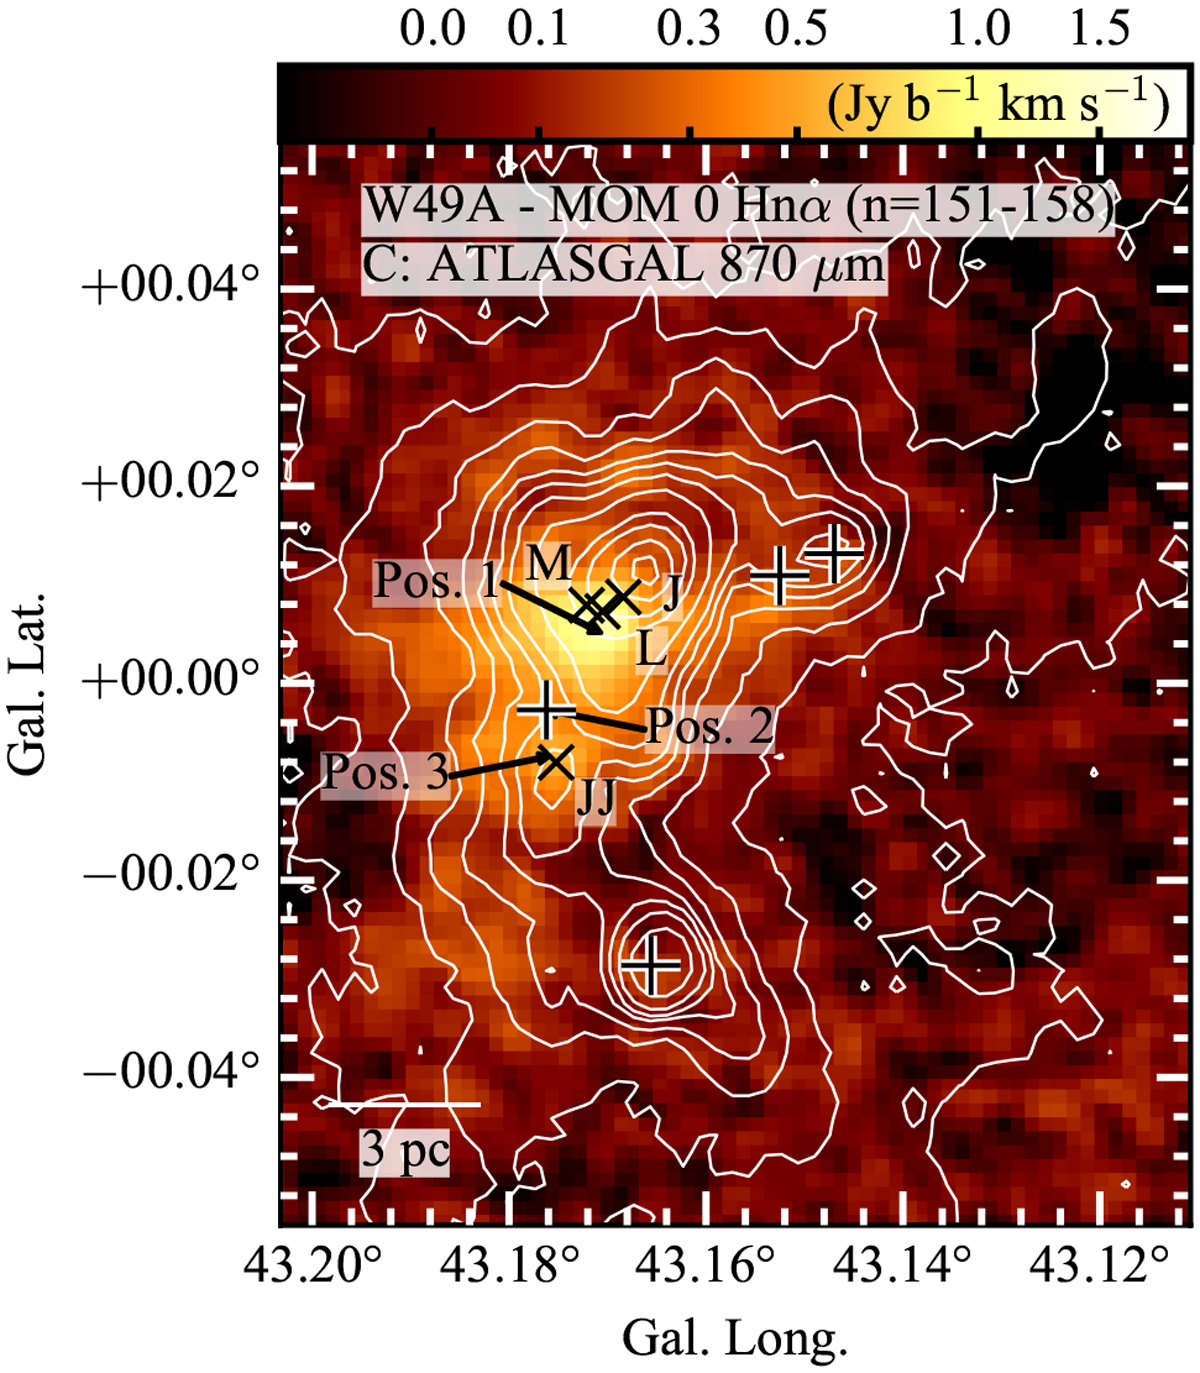
Integrated emission of stacked Hnα (n = 151–158; angular resolution 16.′′8 × 13.′′8, 0.85 pc). The color scale shows velocity integrated intensity (between −40 and 60 km s−1). Contours (white) show 870 μm emission (ATLASGAL survey; Schuller et al. 2009; contours as in Fig. 1). Crosses indicate infrared star clusters (Alves & Homeier 2003). The positions of the spectra shown in Fig. 3 are marked, as well as the locations of the 3.6 cm continuum sources “M”, “L”, “J” and “JJ” (De Pree et al. 1997), which are mentioned in Sects. 3.1 and 5.1 (“x”-shaped symbols).
Current usage metrics show cumulative count of Article Views (full-text article views including HTML views, PDF and ePub downloads, according to the available data) and Abstracts Views on Vision4Press platform.
Data correspond to usage on the plateform after 2015. The current usage metrics is available 48-96 hours after online publication and is updated daily on week days.
Initial download of the metrics may take a while.