Fig. 3
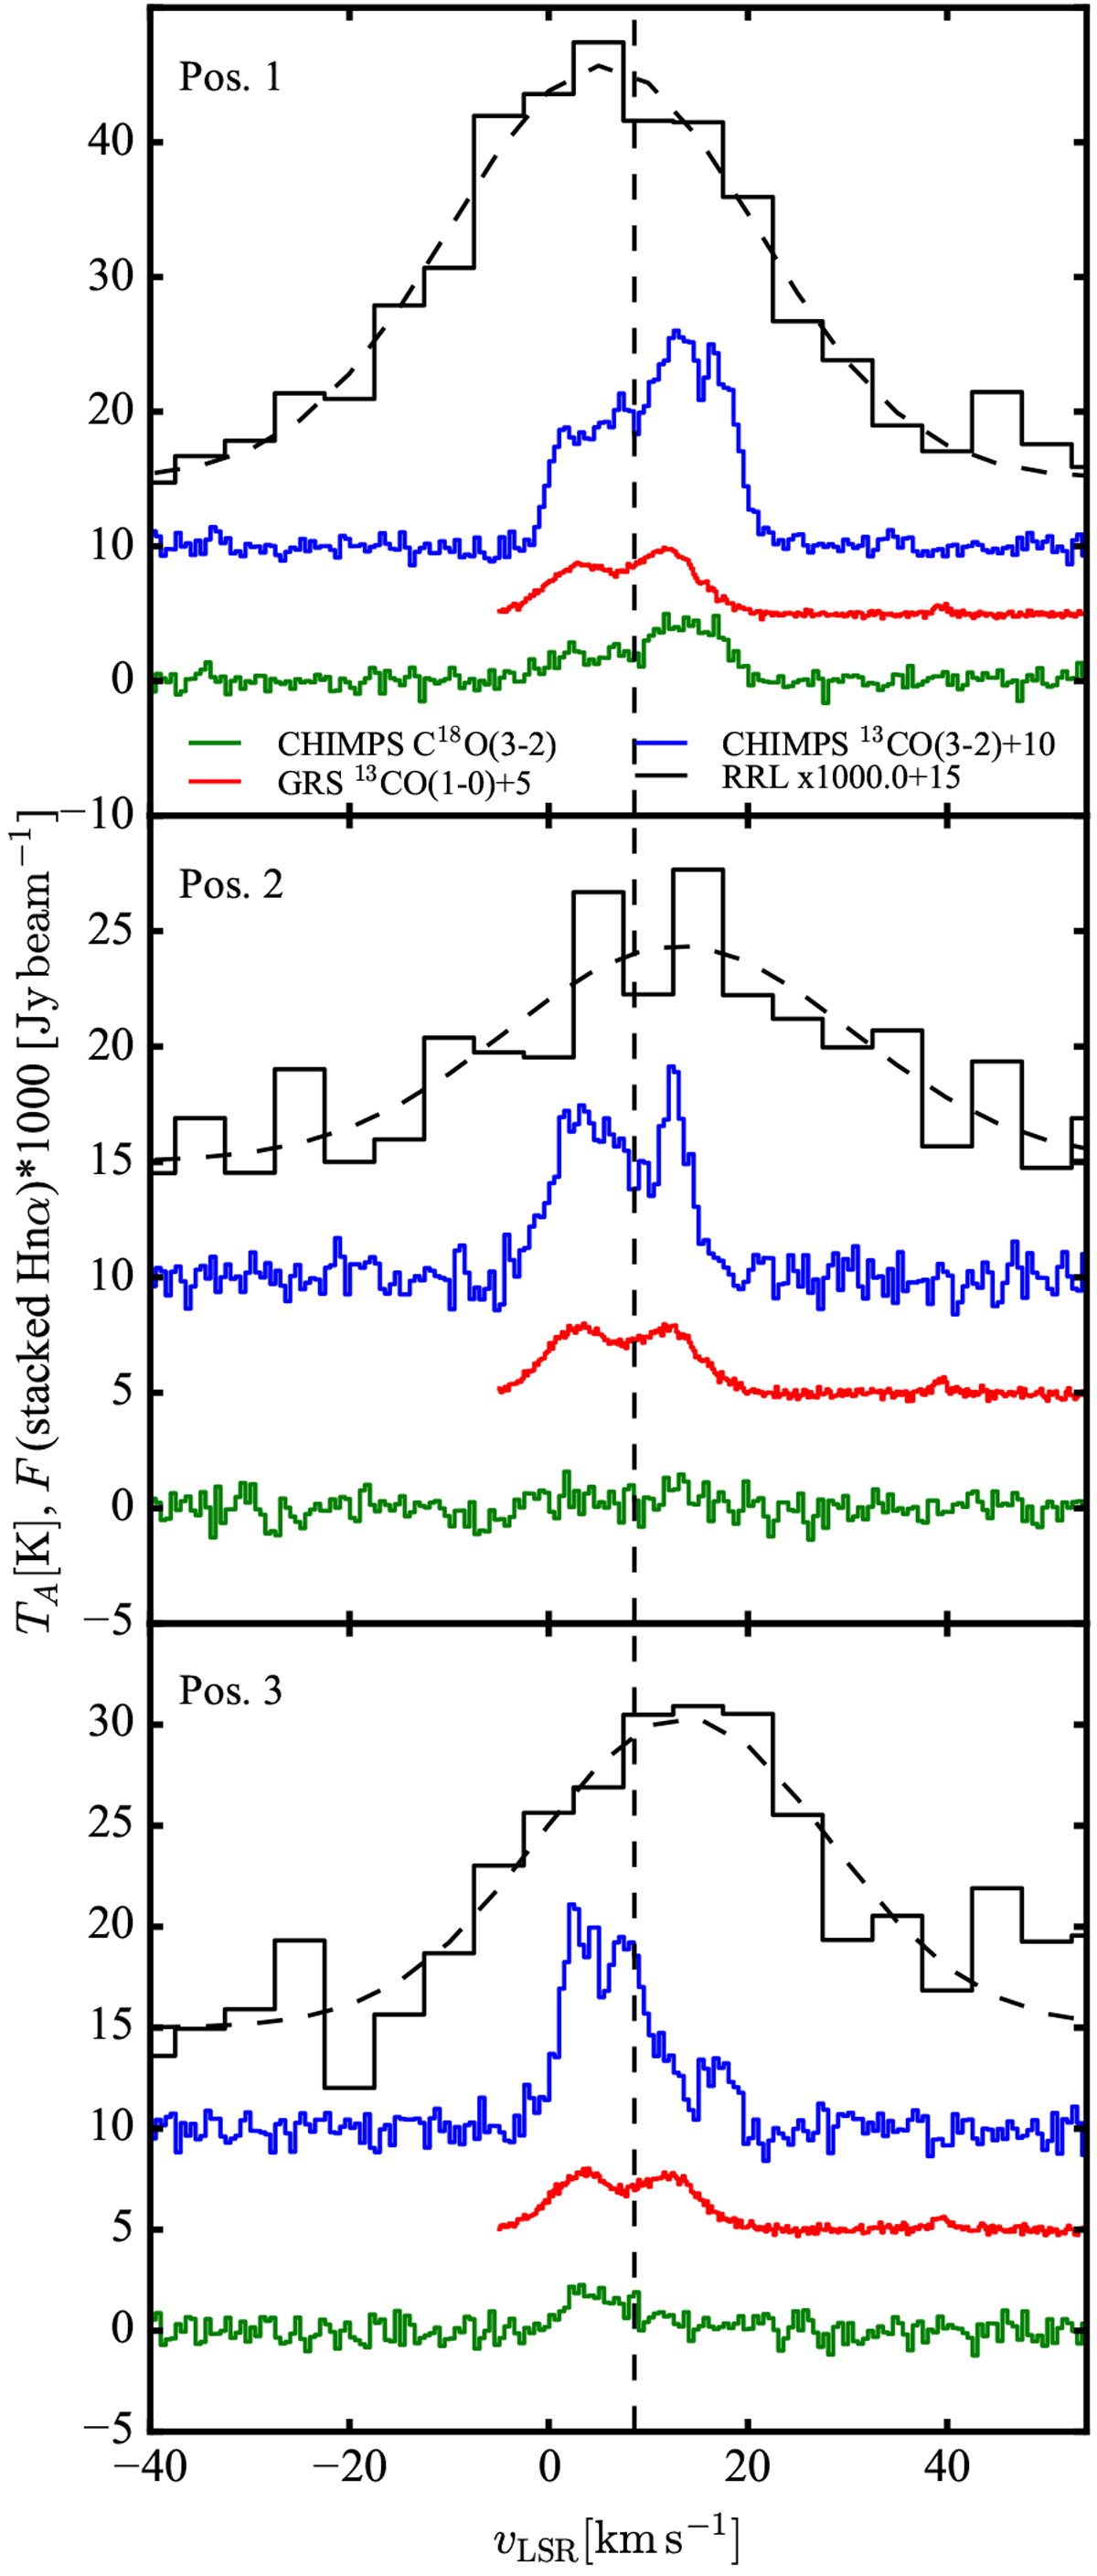
Spectra of Hnα (n = 151–158; black), CHIMPS 13CO(3–2) (blue), GRS 13CO(1–0) (red; data extends only to −5 km s−1) and CHIMPS C18O(3–2) (green), at selected locations in W49A, as indicated in Figs. 2 and 4. The RRL emission is scaled by a factor of 1000, and given in Jy beam−1, while the antenna temperature (TA) of the CO emission is given in K. The black dashed lines indicate the Gaussian fits to the RRL emission mentioned in Sect. 2.3. The vertical black dashed line denotes the systemic velocity (vLSR = 8.6 km s−1; Quireza et al. 2006a). The channel spacing is 5 km s−1for the RRLs, 0.5 km s−1 for CO spectra from CHIMPS, and 0.21 km s−1 for GRS.
Current usage metrics show cumulative count of Article Views (full-text article views including HTML views, PDF and ePub downloads, according to the available data) and Abstracts Views on Vision4Press platform.
Data correspond to usage on the plateform after 2015. The current usage metrics is available 48-96 hours after online publication and is updated daily on week days.
Initial download of the metrics may take a while.