Fig. 4
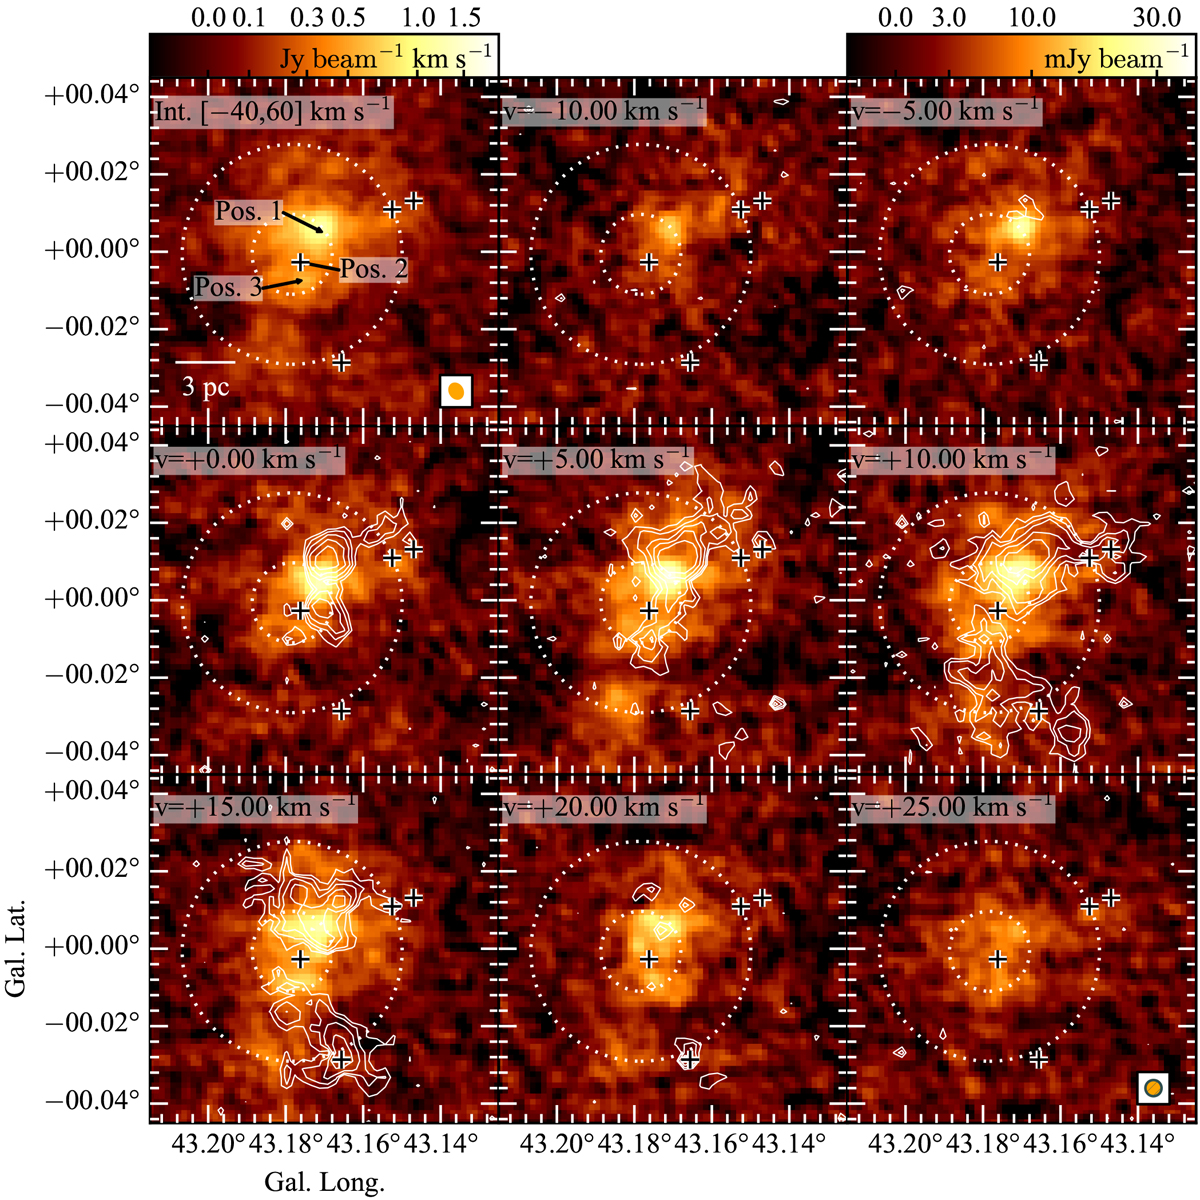
Channel maps of stacked Hnα n = 151–158 shown in color scale. Upper left panel: moment 0 image (velocity integrated emission;Fig. 2), with the positions and numbers of the spectra in Fig. 3 overlaid. The remaining panels show the RRL emission between −10 and 25 km s−1, with the corresponding contours of C18O emission (CHIMPS; Rigby et al. 2016; at levels of TA = 0.65, 1.03,1.63, 2.59, 4.1 K) after binning to 5 km s−1 channels. The white dashed circles denote the shell of an expanding H II region (inner ring) and the assumed extent ofW49A (outer ring) as described in Fig. 1. The center of both radii is l = 43.1783°, b = − 0.0007°. Crosses denote stellar clusters identified in Alves & Homeier (2003). The angular resolution of the RRL emission is shown in the lower right corner of the left panel in the top row (orange). The angular resolution of the C 18 O emission is shown in the right panel of the bottom row, superposed as an empty hatched circle in gray on the RRL beam.
Current usage metrics show cumulative count of Article Views (full-text article views including HTML views, PDF and ePub downloads, according to the available data) and Abstracts Views on Vision4Press platform.
Data correspond to usage on the plateform after 2015. The current usage metrics is available 48-96 hours after online publication and is updated daily on week days.
Initial download of the metrics may take a while.