Fig. 6
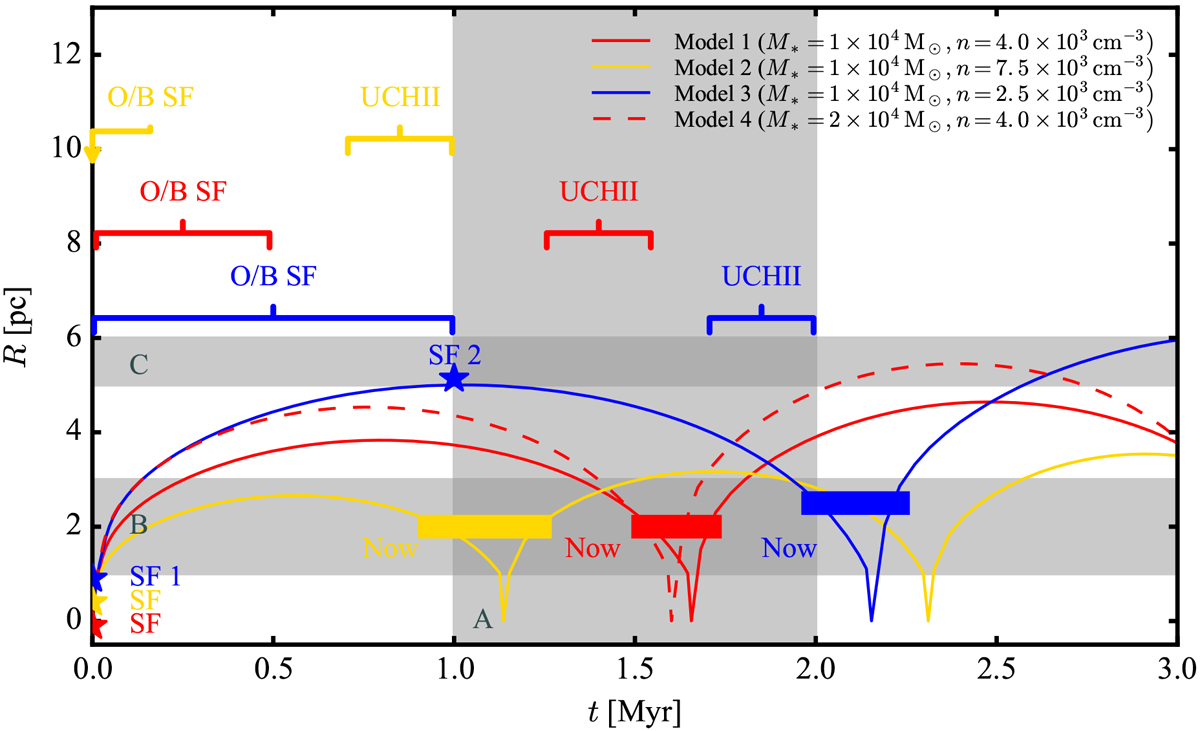
Expansion radius vs. time for models of stellar cluster feedback (WARPFIELD; Rahner et al. 2017) in W49A. t = 0 denotes the formation of the first stellar cluster. Observational constraints on stellar cluster age (A), shell size (B) and extent of W49A (C) are shown in gray. Models 1–3 were computed with molecular gas densities of n = (4.0, 7.5, 2.5) × 103 cm−3, respectively, and a stellar cluster mass of M* = 1 × 10⁴ M⊙. Model 4 used a molecular gas density of n = 4.0 × 103 cm−3 and a stellar cluster mass of M* = 2 × 10⁴ M⊙. For simplicity, the molecular gas density was assumed to be constant (see text for further discussion). Each model agrees best with the observations at the expansion radius indicated by a filled bar (“Now”), which then defines the elapsed time. The stars with labels “SF” or “SF 1” denote the time of the formation of the first stellar cluster in the model. To put the models into perspective, the observational constraints from the perspective of today (filled bars) on the age of the O/B cluster and the UC H II regions are highlighted by brackets in the top part of the plot (“O/B SF” or “UC H II”). The observational constraints on the O/B star formation in Model 2 (indicated by a yellow arrow) coincides approximately with the formation of the first star cluster in the model. For Model 3, “SF 2” marks the radius and time at which the model reaches the outskirts of W49A (no additional star formation is added to the model at this point).
Current usage metrics show cumulative count of Article Views (full-text article views including HTML views, PDF and ePub downloads, according to the available data) and Abstracts Views on Vision4Press platform.
Data correspond to usage on the plateform after 2015. The current usage metrics is available 48-96 hours after online publication and is updated daily on week days.
Initial download of the metrics may take a while.