Fig. A.2
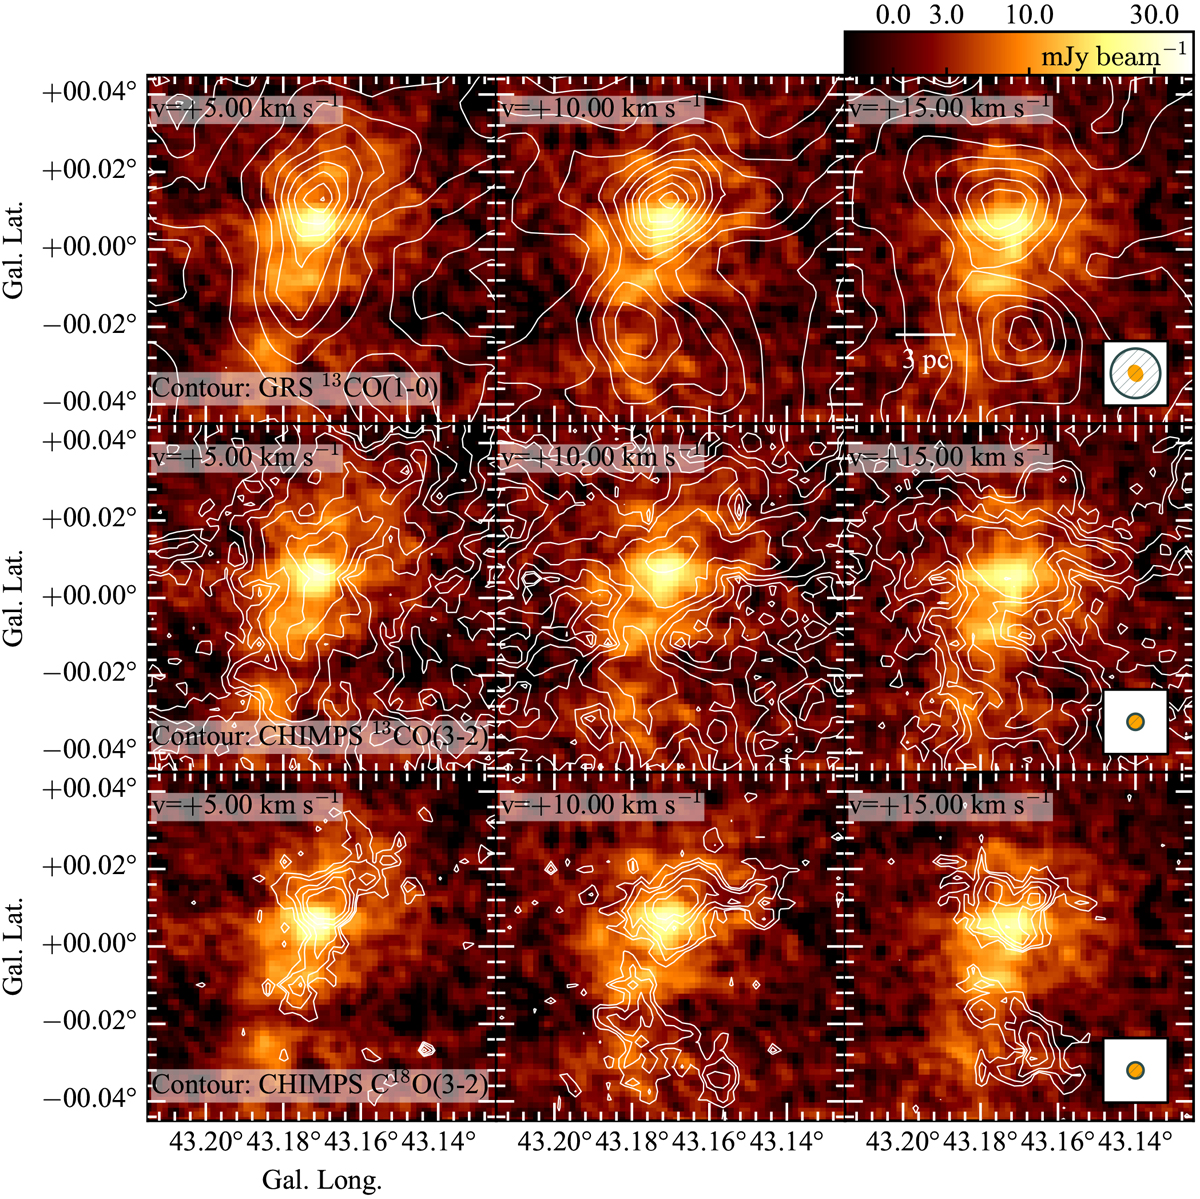
RRL emission as in Fig. 4 for 5–15 km s−1. Overlaid as contours are GRS 13CO(1–0), CHIMPS 13CO(3–2) and C18 O(3–2). The contours are shown for the GRS 13CO(1–0) emission at levels of 0.075, 0.125, 0.25, 0.5, 1.0, 1.5, 2.0, 2.5, 3.0, 3.5, 4.0, 4.5, and 5.0 K, for the CHIMPS 13CO(3–2) emissionat levels of 0.45, 0.9, 1.79, 3.57, 7.13, and 14.23 K, and for the C18 O(3–2) emission at levels of 0.65, 1.03, 1.63, 2.59, and 4.1 K. The angular resolution of the data is shown in the right column. The colored beam indicates the resolution of the RRL data (16.′′ 8 × 13.′′8), with the beam of the CO emission overlayed in gray (46′′ for GRS 13CO(1–0) emission and15′′ for CHIMPS 13CO(3–2) and C18 O(3–2) emission).
Current usage metrics show cumulative count of Article Views (full-text article views including HTML views, PDF and ePub downloads, according to the available data) and Abstracts Views on Vision4Press platform.
Data correspond to usage on the plateform after 2015. The current usage metrics is available 48-96 hours after online publication and is updated daily on week days.
Initial download of the metrics may take a while.