Fig. 8.
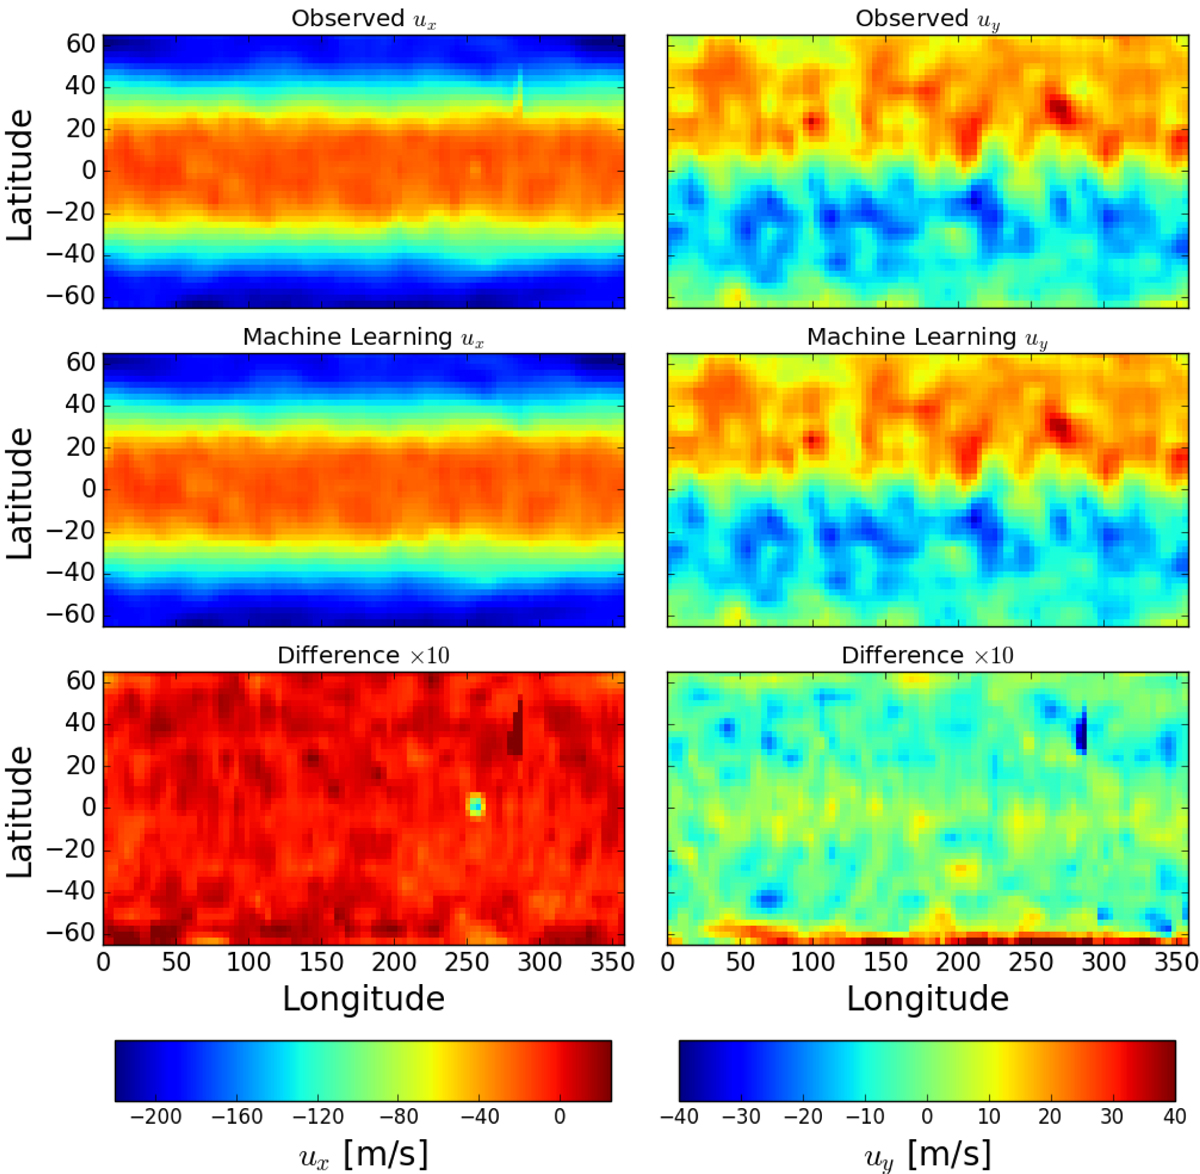
Comparison of the flow maps for ux (left panel) and uy (right panel) between the pipeline (top panel) and machine learning (middle panel), and the difference between them (bottom panel, scaled by factor 10) at a target depth of 0.696 Mm. The maps are generated from a time average over the CR 2100. The predicted values were obtained from an ANN trained using CR 2107-2201.
Current usage metrics show cumulative count of Article Views (full-text article views including HTML views, PDF and ePub downloads, according to the available data) and Abstracts Views on Vision4Press platform.
Data correspond to usage on the plateform after 2015. The current usage metrics is available 48-96 hours after online publication and is updated daily on week days.
Initial download of the metrics may take a while.