Fig. 3.
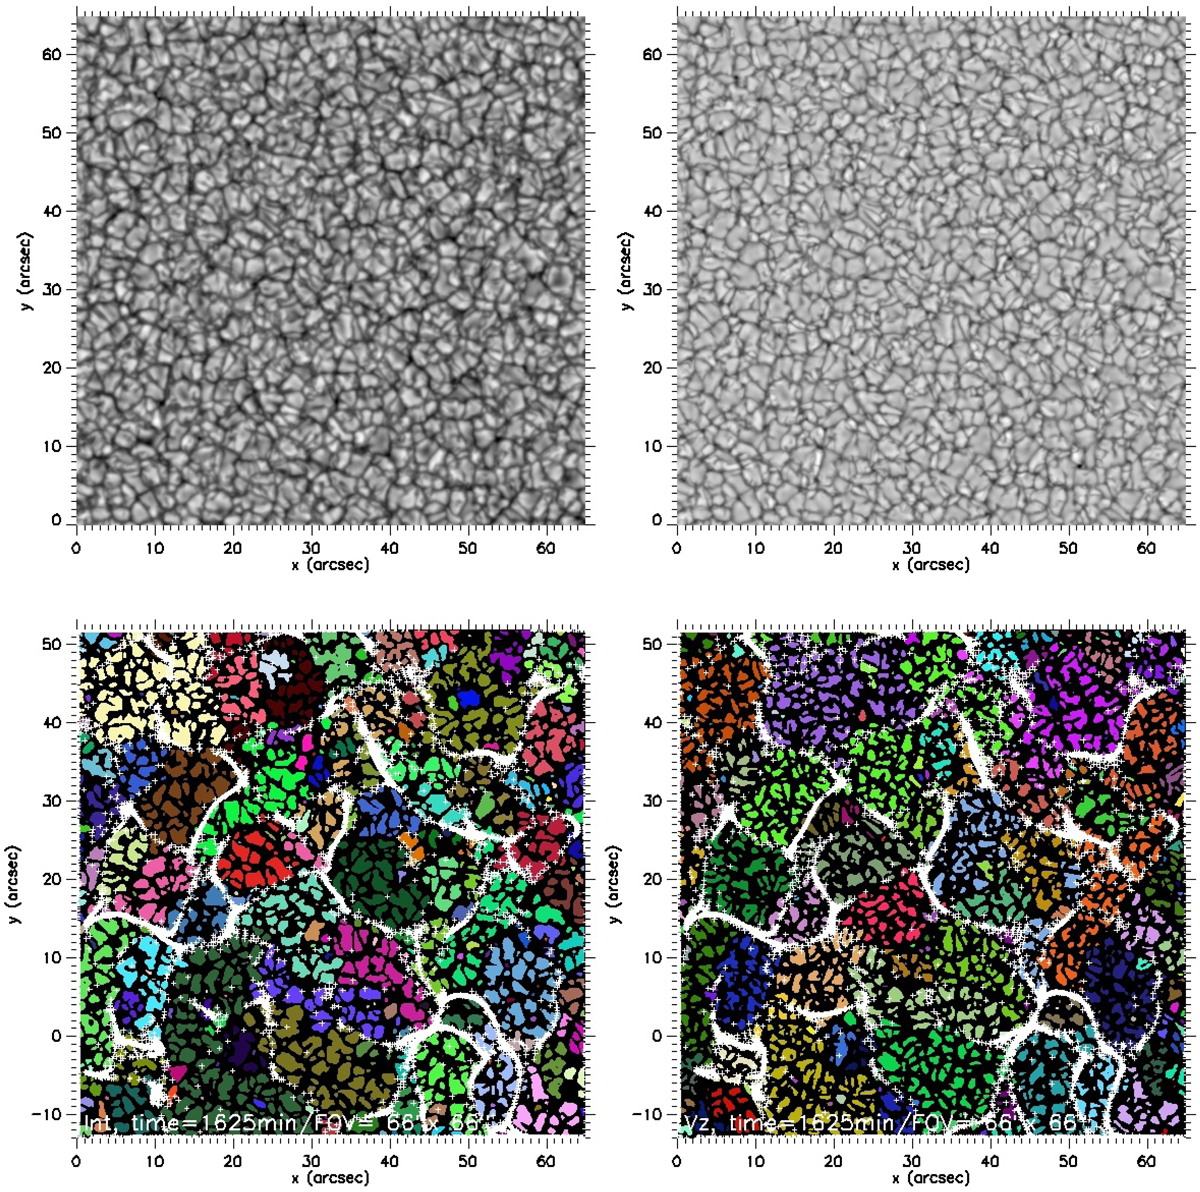
Top panel: typical emergent intensity (left panel) and vertical velocity Vz (right panel) at the surface (z = 0 Mm) from the 24 h simulation. Bottom panel: TFG and corks (white crosses) detected from the emergent intensity at the end of the 24 h simulation (left panel); TFG detected from the velocity component Vz with corks derived from the horizontal plasma velocity Vx, Vy (right panel). The movie1.mp4 shows the temporal evolution of the bottom figures. The time step is 60 s; field of view (FOV) is 65″ × 65″.
Current usage metrics show cumulative count of Article Views (full-text article views including HTML views, PDF and ePub downloads, according to the available data) and Abstracts Views on Vision4Press platform.
Data correspond to usage on the plateform after 2015. The current usage metrics is available 48-96 hours after online publication and is updated daily on week days.
Initial download of the metrics may take a while.