Fig. 5.
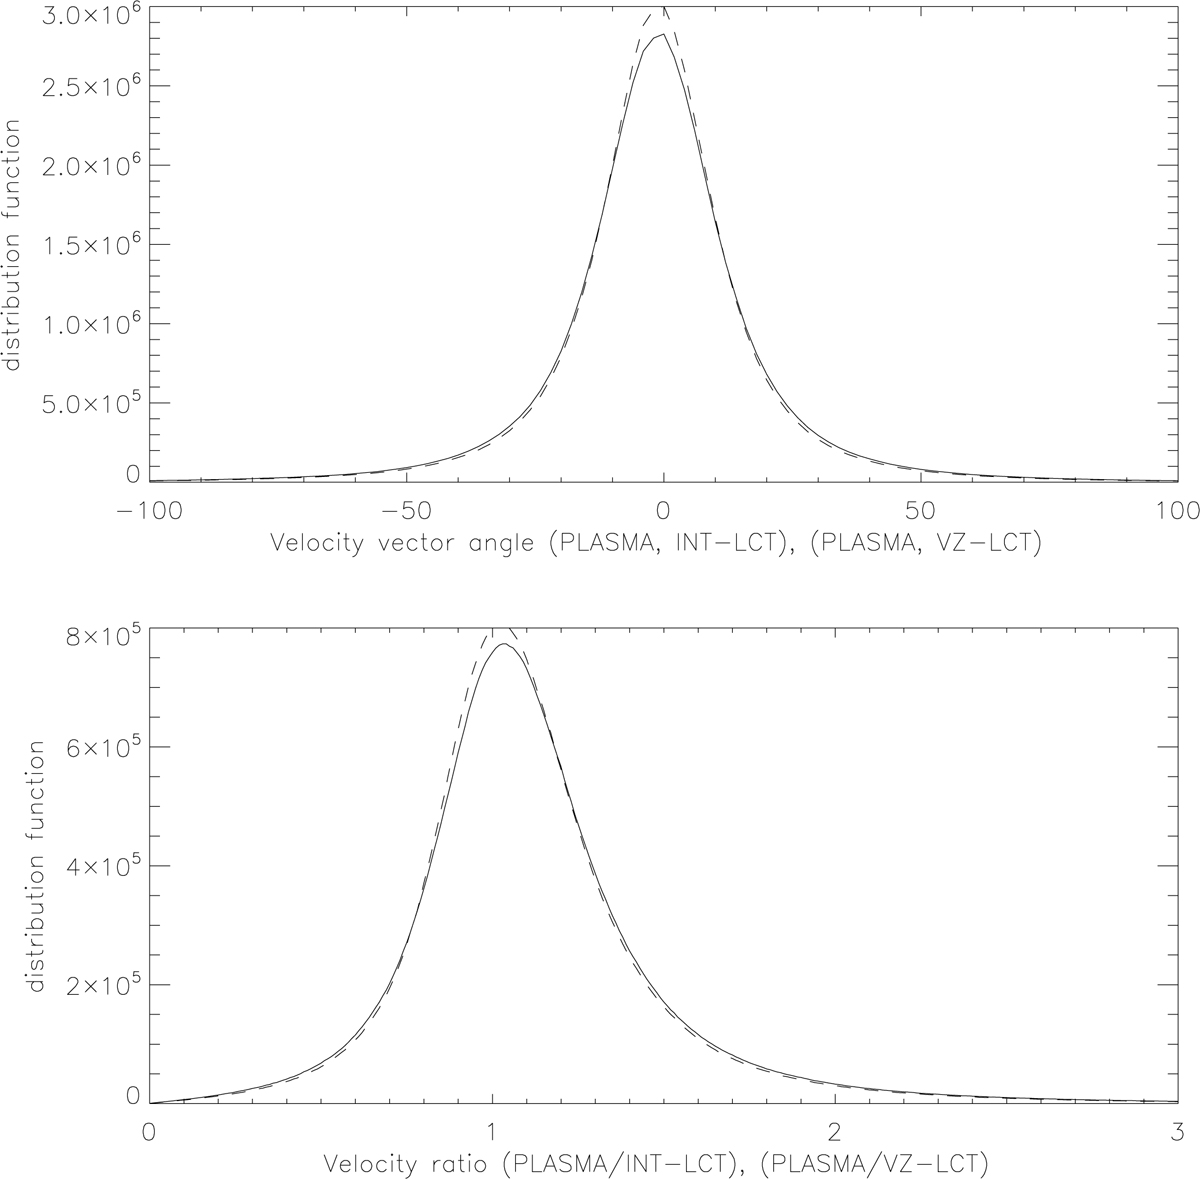
Comparison between velocities of the plasma and velocities obtained with LCT on emergent intensity (solid line) and comparison between plasma velocities and velocities obtained with LCT on Vz (dotted line). The LCT windows 30 min and 3″ 24 h statistics. Top panel: angular shift between velocity vectors. Bottom: ratio between velocity vector modules.
Current usage metrics show cumulative count of Article Views (full-text article views including HTML views, PDF and ePub downloads, according to the available data) and Abstracts Views on Vision4Press platform.
Data correspond to usage on the plateform after 2015. The current usage metrics is available 48-96 hours after online publication and is updated daily on week days.
Initial download of the metrics may take a while.