Fig. 7.
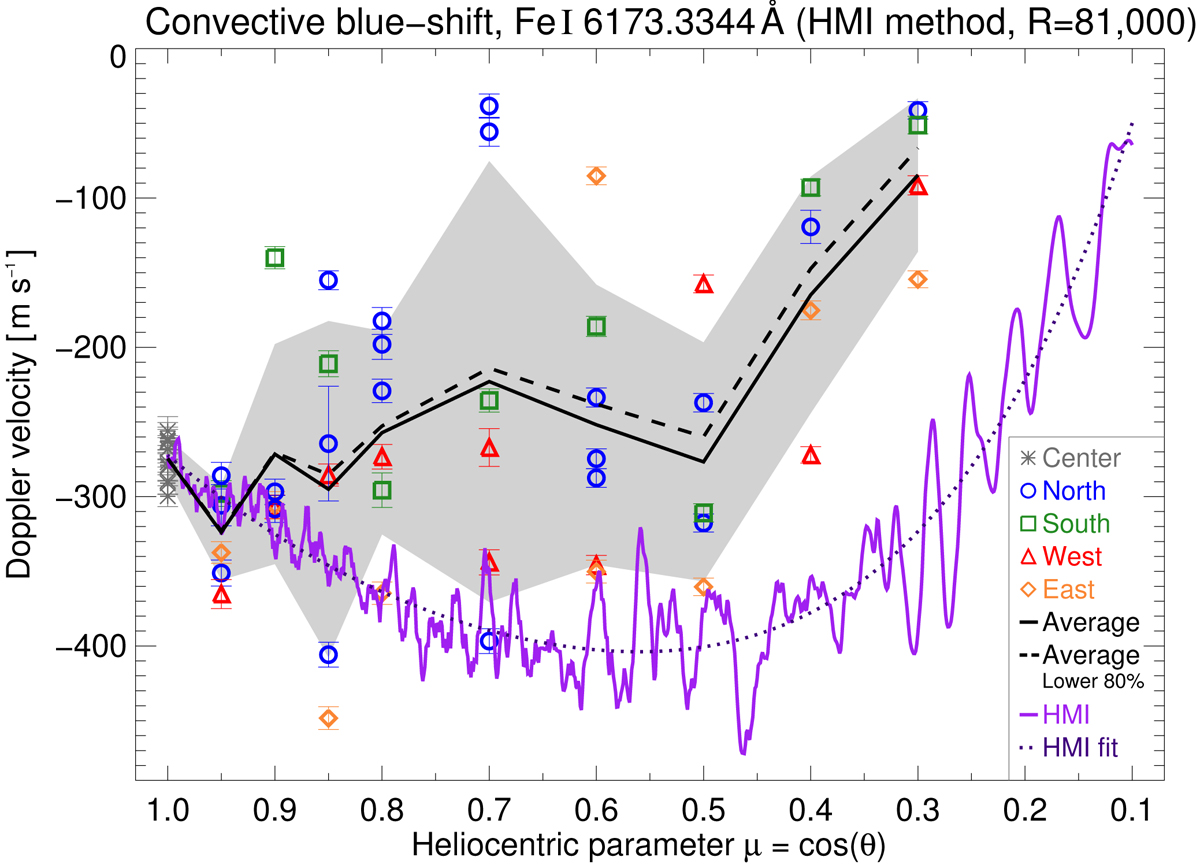
Comparison of the convective blueshift between the adapted LARS data and HMI. Contrary to Fig. 4, the Doppler velocities were obtained with the HMI approach on the LARS spectra at a degraded resolution of 81 000. Colors and symbols indicate the radial axis of the solar disk. The mean curve and its standard deviation are displayed as black solid line and gray area. The original mean center-to-limb variation from Fig. 4, obtained by the average of the lower 80 % of the bisector profile, is added as black dashed line. The HMI curve and its polynomial fit are drawn as purple lines.
Current usage metrics show cumulative count of Article Views (full-text article views including HTML views, PDF and ePub downloads, according to the available data) and Abstracts Views on Vision4Press platform.
Data correspond to usage on the plateform after 2015. The current usage metrics is available 48-96 hours after online publication and is updated daily on week days.
Initial download of the metrics may take a while.