Open Access
Fig. A.3.
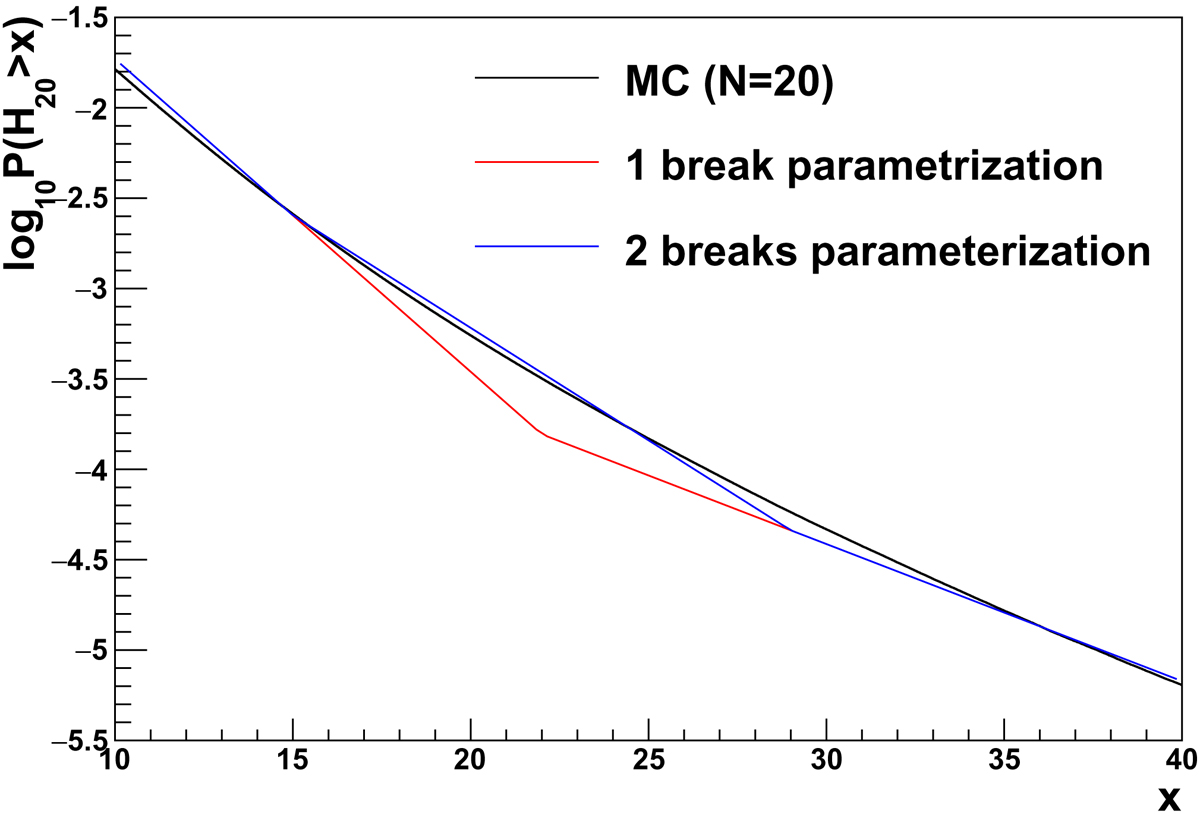
Logarithm of the H20 cumulative distribution for N = 20 in the x range where a single broken linear polynomial does not provide a good approximation. The black line corresponds to the MC result while the red and blue curves correspond to the single and double broken linear polynomial approximations, respectively.
Current usage metrics show cumulative count of Article Views (full-text article views including HTML views, PDF and ePub downloads, according to the available data) and Abstracts Views on Vision4Press platform.
Data correspond to usage on the plateform after 2015. The current usage metrics is available 48-96 hours after online publication and is updated daily on week days.
Initial download of the metrics may take a while.