Open Access
Fig. 5.
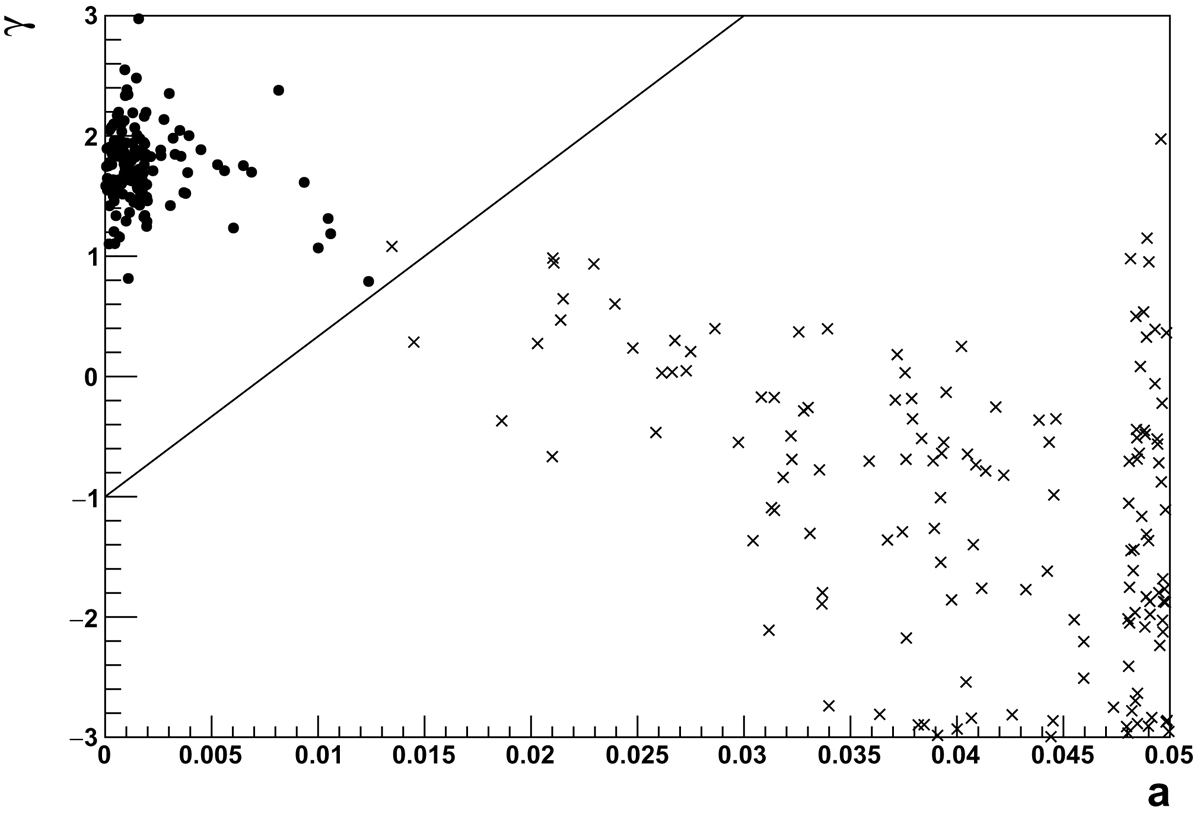
Position of the lowest (dots) and highest (crosses) a points of ℰ90 (the region of the (a, γ) plane with Pw larger than 90% of the maximum) for the 144 pulsar sample. The solid line corresponds to the line Lm along which a scan is performed to obtain the model weight pulsation significance, as described in Sect. 4.4.
Current usage metrics show cumulative count of Article Views (full-text article views including HTML views, PDF and ePub downloads, according to the available data) and Abstracts Views on Vision4Press platform.
Data correspond to usage on the plateform after 2015. The current usage metrics is available 48-96 hours after online publication and is updated daily on week days.
Initial download of the metrics may take a while.