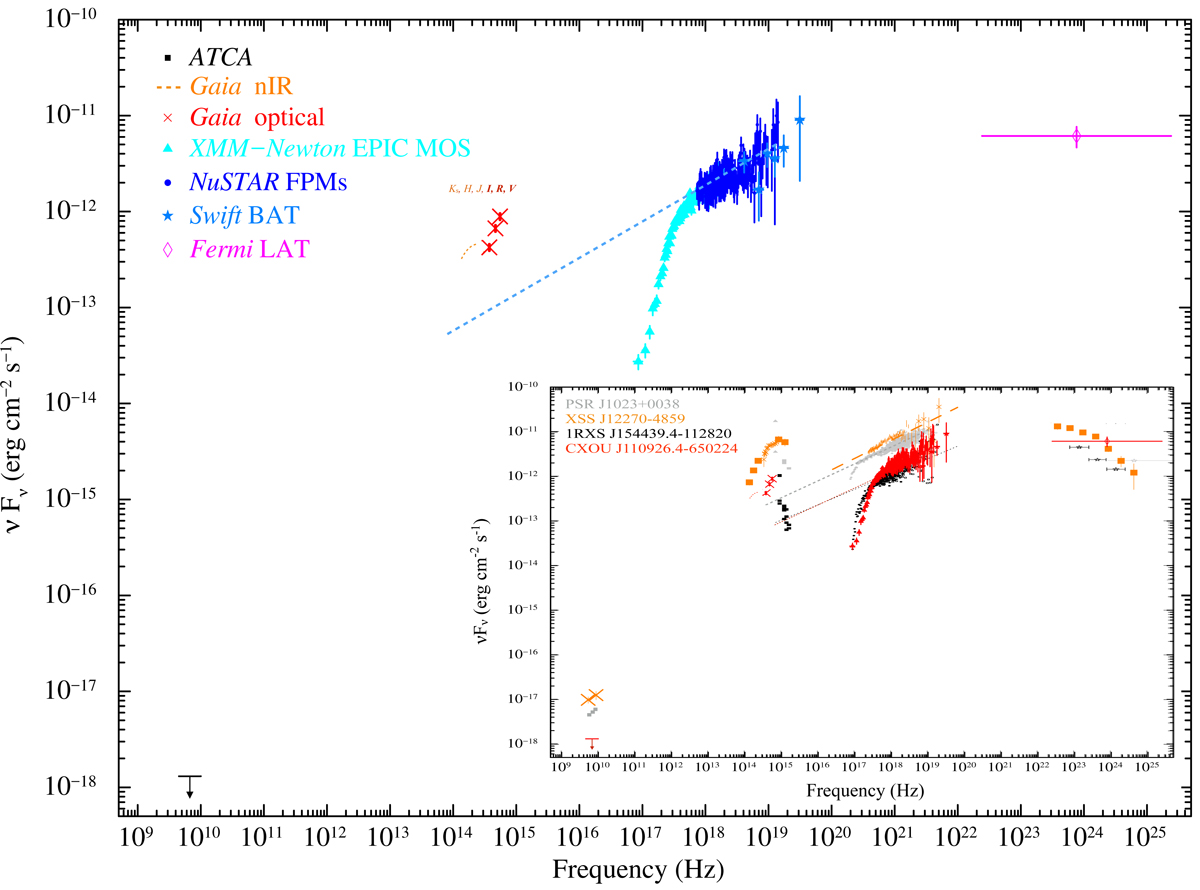
Fig. 14.
Download original image
Large panel: time-averaged spectral energy distribution of J1109 from the radio to the gamma-ray band. Vertical bars represent 1σ statistical uncertainties, whereas arrowheads indicate 95% upper limits. The blue dashed line represents the best-fitting power-law model for the average X-ray emission detected with XMM-Newton and NuSTAR, and its extrapolation to the optical and nIR bands. The X-ray spectrum has not been corrected for absorption. Inset: SEDs of J1109, PSR J1023+0038 (taken from Bogdanov et al. 2015), XSS J12270−4859 (from de Martino et al. 2015) and 1RXS J154439.4−112820 (from Bogdanov et al. 2018 for the optical, UV and X-ray data) plotted together to highlight their similarities among these systems in the sub-luminous accretion disk state (we note in particular the virtually identical slope of the power law model in the X-ray band).
Current usage metrics show cumulative count of Article Views (full-text article views including HTML views, PDF and ePub downloads, according to the available data) and Abstracts Views on Vision4Press platform.
Data correspond to usage on the plateform after 2015. The current usage metrics is available 48-96 hours after online publication and is updated daily on week days.
Initial download of the metrics may take a while.