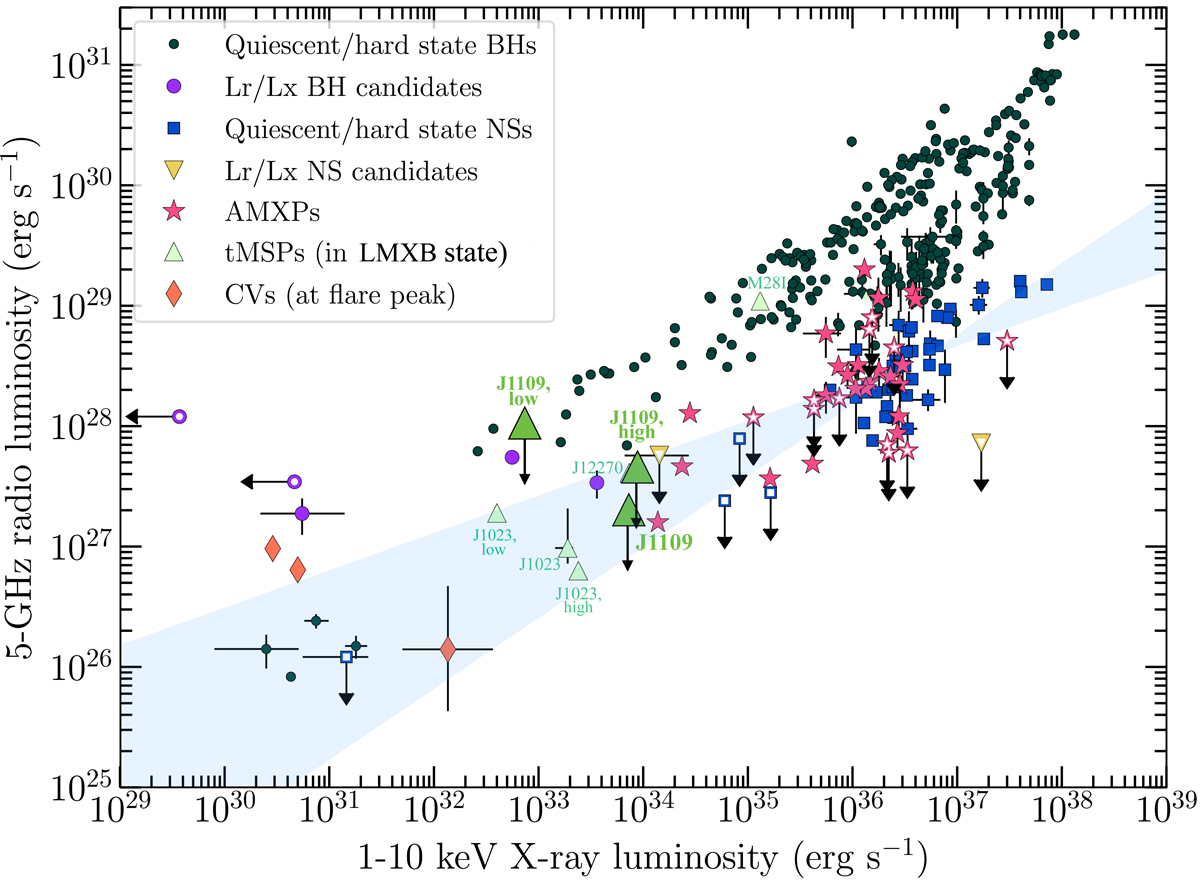
Fig. 15.
Download original image
Radio vs. X-ray luminosity plane for different classes of accreting compact objects, adapted from Bahramian et al. (2018b). Data points for PSR J1023+0038 and J1109 (see the green triangles) are plotted also separately for the high and low X-ray modes (Bogdanov et al. 2018 and this work). The data point for IGR J18245−2452 (M28I) was derived from strictly simultaneous ATCA and Swift XRT observations (Ferrigno et al. 2014), and we computed its position on the plane after performing time-resolved spectral analysis of Swift XRT data (obs. ID 00032785003). Upper limits are denoted by arrowheads. The cyan shaded area encloses the 3σ confidence interval on the shape of the correlation holding for accreting NSs (see Gallo et al. 2018 and the text for more details).
Current usage metrics show cumulative count of Article Views (full-text article views including HTML views, PDF and ePub downloads, according to the available data) and Abstracts Views on Vision4Press platform.
Data correspond to usage on the plateform after 2015. The current usage metrics is available 48-96 hours after online publication and is updated daily on week days.
Initial download of the metrics may take a while.