Fig. 3.
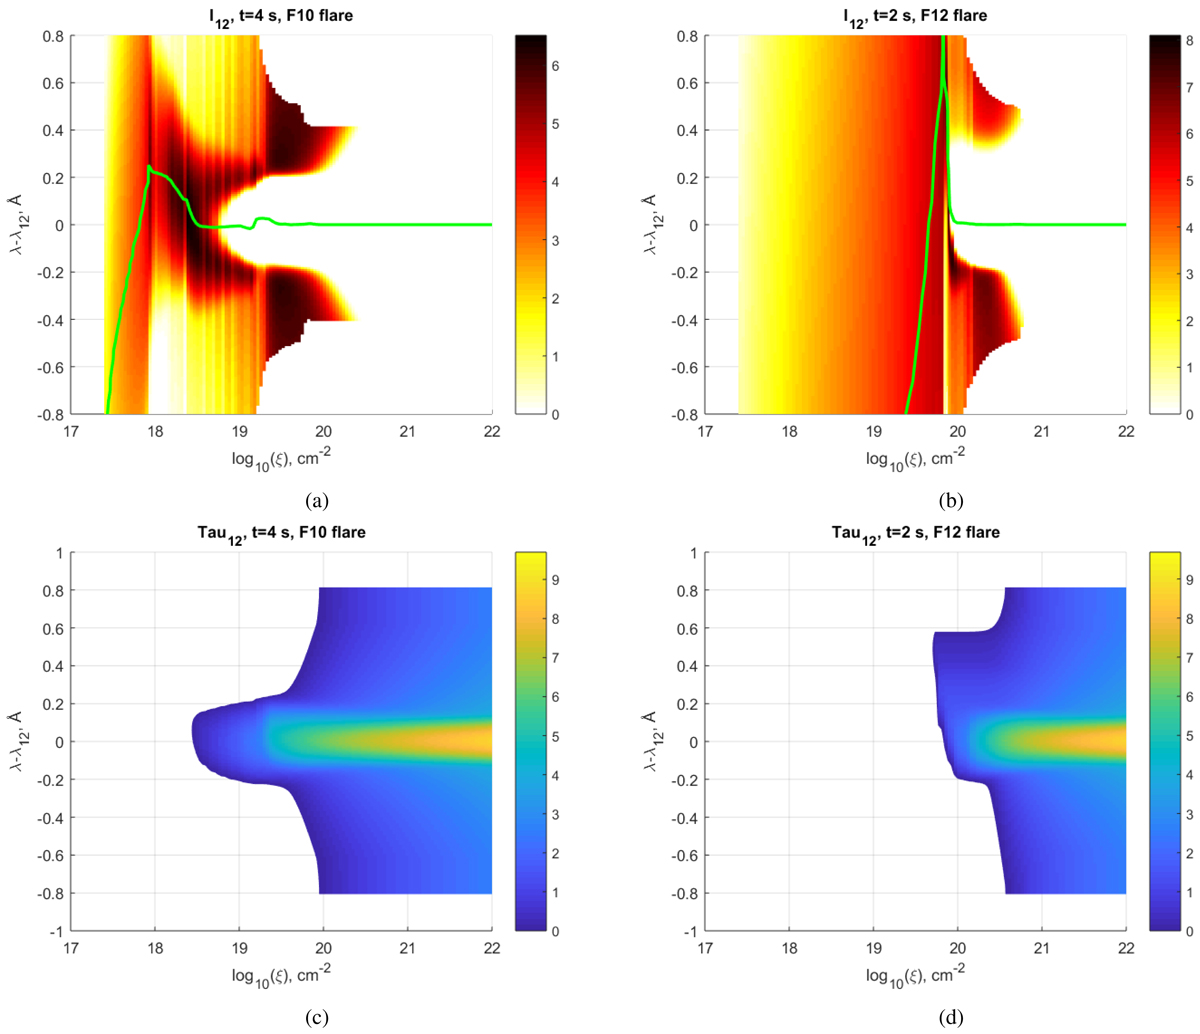
Lyα line contribution functions (top row) and optical depths (bottom row) plotted for the wavelength relative to the line centre (1216 Å) versus the column depths during the beam injection. The contributions to the Lyα emission intensity are shown in panel a at 4 s in the F10 model and panel b at 2 s in the F12 model. The colour scale runs from light (low contribution) to dark (high contribution) in the logarithmic scale (contribution function + 1) panels, and the relevant plasma macro-velocity profiles are scaled to their resulting Doppler shifts, then plotted over the top of the contribution functions using a green line. Bottom panels: optical depths at the similar times. The logarithmic scale optical depths are shown starting from a value of τ = 1 (blue) and increasing to an optical depth of > 109 in the line centre at the base of the model (yellow).
Current usage metrics show cumulative count of Article Views (full-text article views including HTML views, PDF and ePub downloads, according to the available data) and Abstracts Views on Vision4Press platform.
Data correspond to usage on the plateform after 2015. The current usage metrics is available 48-96 hours after online publication and is updated daily on week days.
Initial download of the metrics may take a while.