Fig. 12.
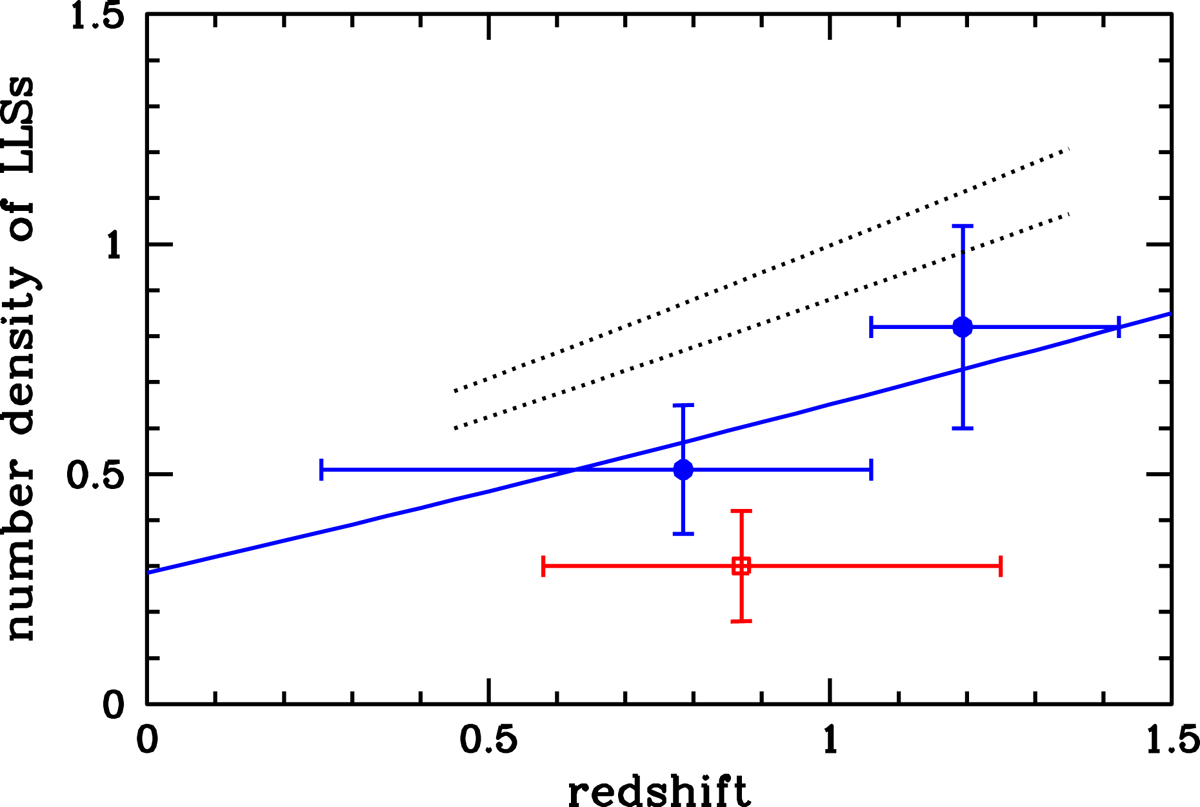
Redshift density l(z) of LLSs (τ > 1) per unit redshift at z < 1.5 from Ribaudo et al. (2011) (blue solid circle) and Songaila & Cowie (2010) (red open square). Blue solid line is the redshift evolution law that Ribaudo et al. (2011) deduced from their data and used as reference in our simulation. Overdensities of LLSs resulting from the simulation are shown as black dotted lines in the range 0.45 < z < 1.35 for αν = −2: bottom line, over–density of 1.5 (β1 = −1.7, β2 = −1.7); top line, overdensity of 1.7 (β1 = −1.7, β2 = −1.5). For comparison with the spectroscopic measurements these lines are shown after correction for a 10% contribution from Proximate LLSs resulting in overdensities of 1.35 and 1.54 respectively in the plot.
Current usage metrics show cumulative count of Article Views (full-text article views including HTML views, PDF and ePub downloads, according to the available data) and Abstracts Views on Vision4Press platform.
Data correspond to usage on the plateform after 2015. The current usage metrics is available 48-96 hours after online publication and is updated daily on week days.
Initial download of the metrics may take a while.