Fig. 1.
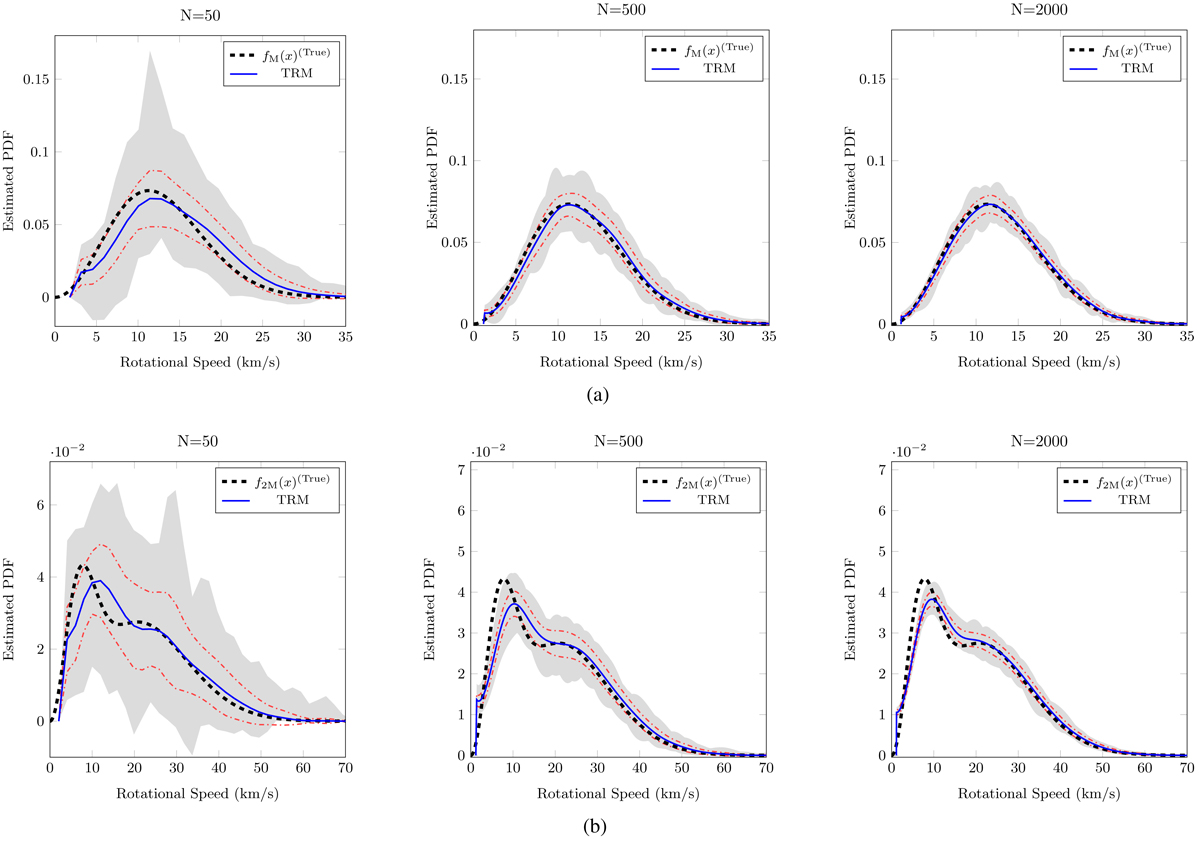
Monte Carlo simulation results to true rotational velocities PDF estimation: panel a: using TRM algorithm for unimodal Maxwellian distribution. Panel b: using TRM algorithm for bimodal Maxwellian distribution. The black line represents the true rotational velocities PDF. The blue line represents the average of the estimated PDF using TRM. The region between the red dashed-dotted lines corresponds to one standard deviation level of the all estimated PDFs.
Current usage metrics show cumulative count of Article Views (full-text article views including HTML views, PDF and ePub downloads, according to the available data) and Abstracts Views on Vision4Press platform.
Data correspond to usage on the plateform after 2015. The current usage metrics is available 48-96 hours after online publication and is updated daily on week days.
Initial download of the metrics may take a while.