Fig. 4.
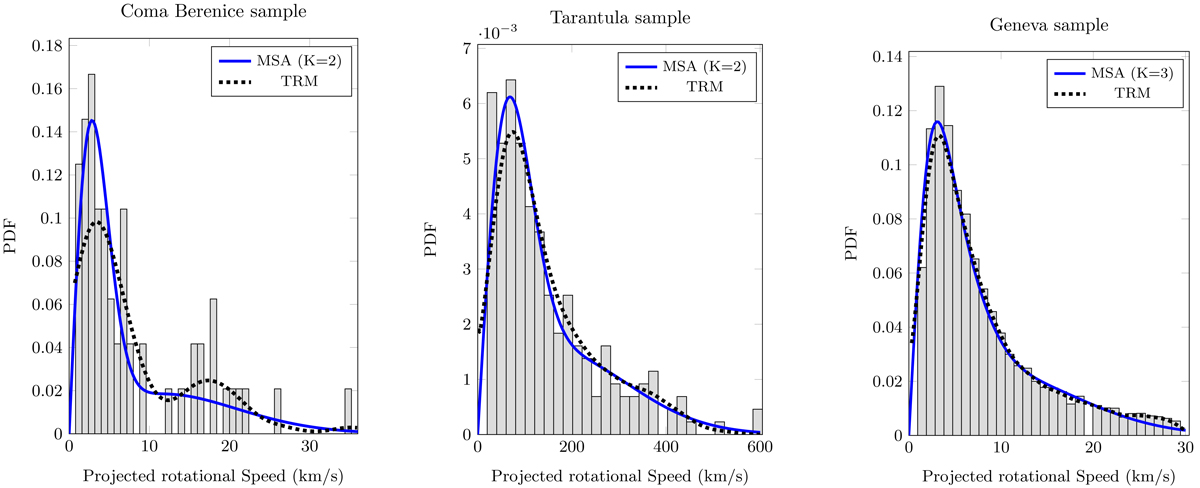
Contrasting projected and observed rotational velocities for the real samples using K = 2 (Coma Berenice and Tarantula samples) and K = 3 (Geneva sample) for MSA algorithm. Gray bars correspond to Histograms of the projected rotational velocities for the real samples. The blue line represents the corresponding estimated fY(y|β) using MSA. The black dashed-dotted line represents the corresponding estimated fY(y|β) using TRM.
Current usage metrics show cumulative count of Article Views (full-text article views including HTML views, PDF and ePub downloads, according to the available data) and Abstracts Views on Vision4Press platform.
Data correspond to usage on the plateform after 2015. The current usage metrics is available 48-96 hours after online publication and is updated daily on week days.
Initial download of the metrics may take a while.