Free Access
Fig. 5.
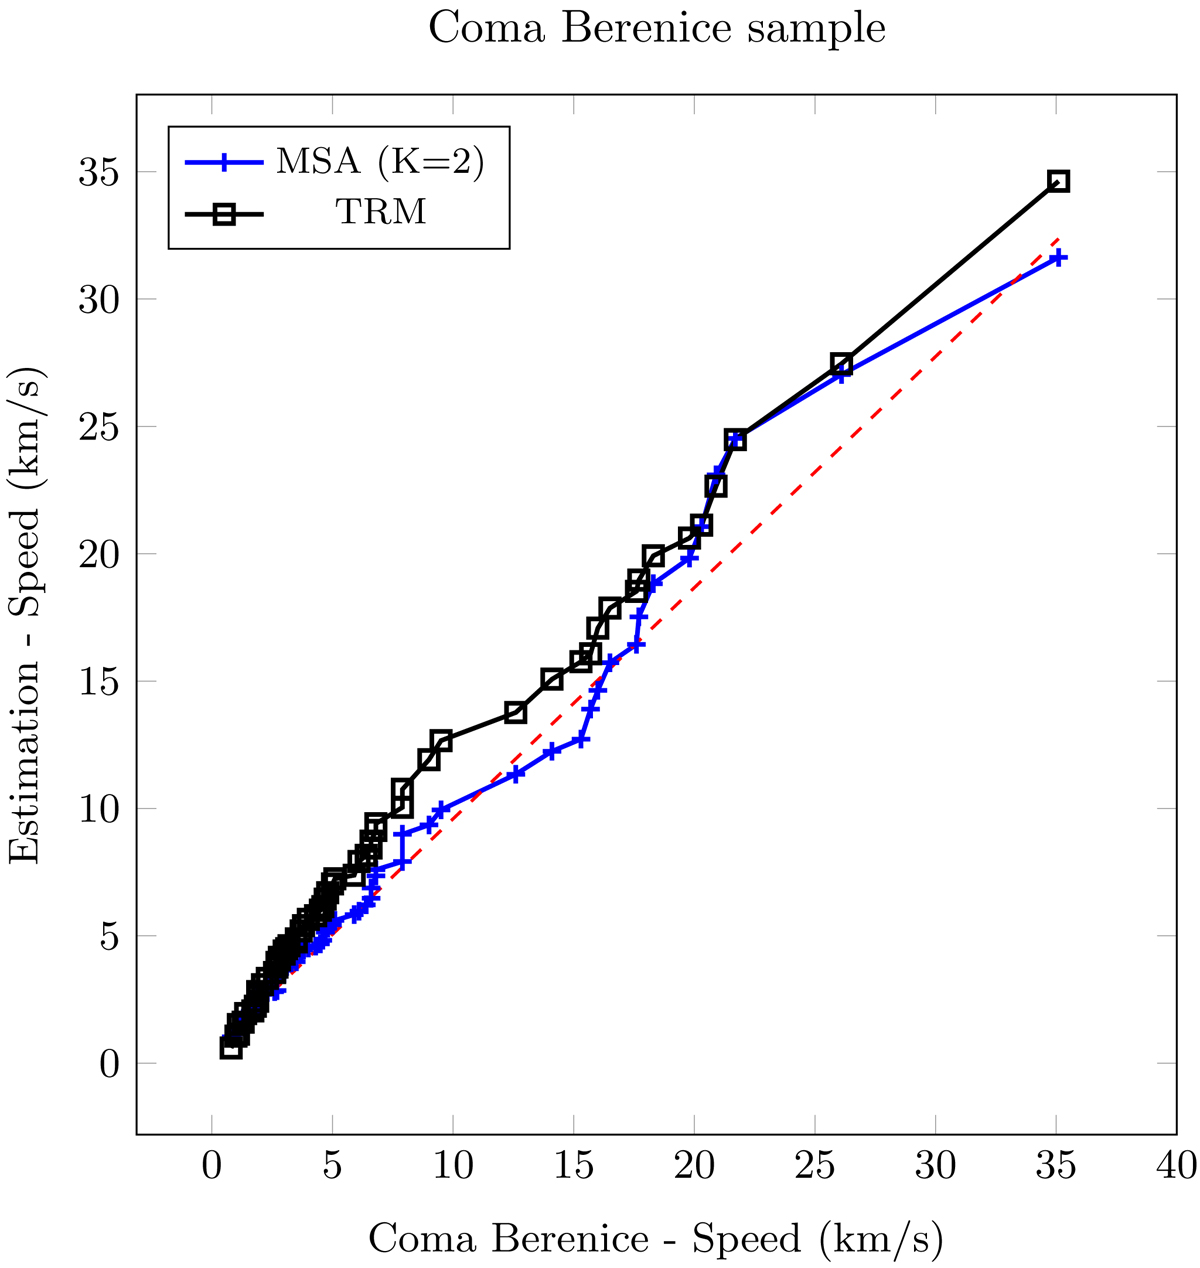
q–q plot from Coma Berenice sample. The blue-mark line represents the quantiles of the corresponding estimated fY(y|β) using MSA. The black-square line represents the quantiles of the corresponding estimated fY(y|β) using TRM. The red-dashed line is the reference line.
Current usage metrics show cumulative count of Article Views (full-text article views including HTML views, PDF and ePub downloads, according to the available data) and Abstracts Views on Vision4Press platform.
Data correspond to usage on the plateform after 2015. The current usage metrics is available 48-96 hours after online publication and is updated daily on week days.
Initial download of the metrics may take a while.