Fig. 1.
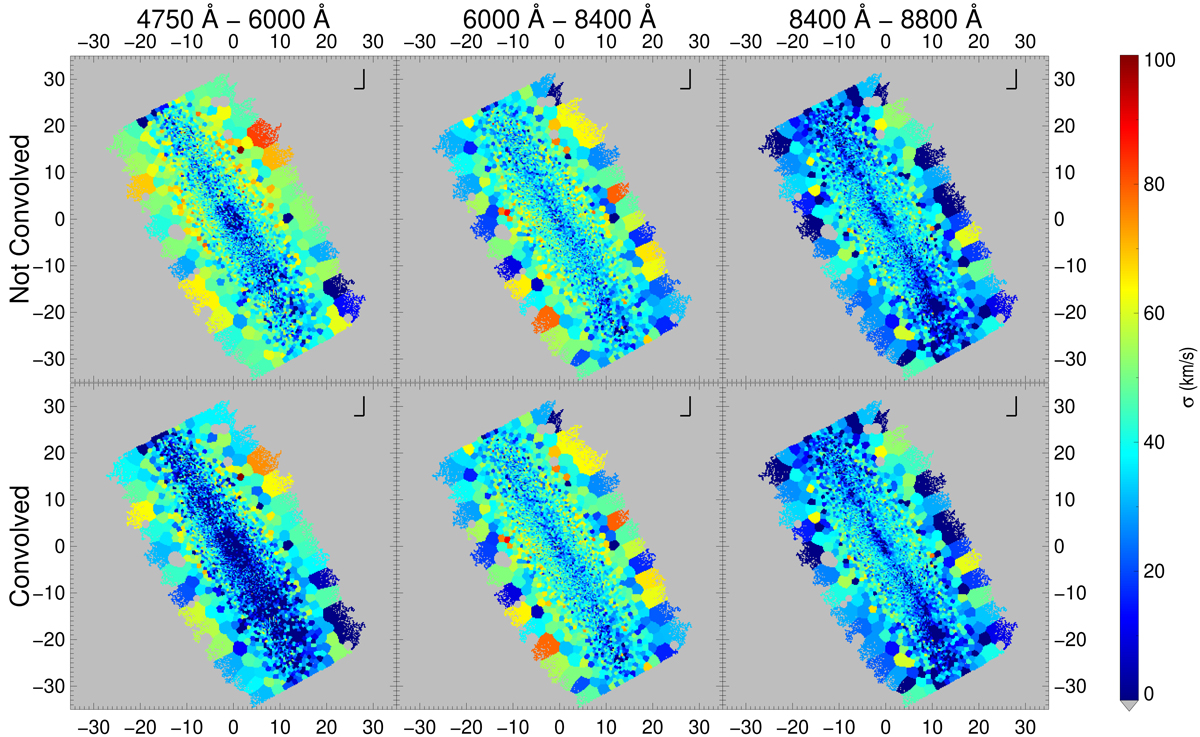
Velocity dispersion maps of ESO 157-49 for different wavelength ranges (“blue” for the left column, “red” for the middle column, and “infrared” for the right column). Maps in the top row were computed from spectra directly obtained from the processed datacubes. Maps in the lower row were made using spectra and SED templates that have been convolved to a common spectral FWHM as explained in the text. The axes are in arcseconds. The north and the east are indicated by the “backwards-L” symbol.
Current usage metrics show cumulative count of Article Views (full-text article views including HTML views, PDF and ePub downloads, according to the available data) and Abstracts Views on Vision4Press platform.
Data correspond to usage on the plateform after 2015. The current usage metrics is available 48-96 hours after online publication and is updated daily on week days.
Initial download of the metrics may take a while.