Fig. 10.
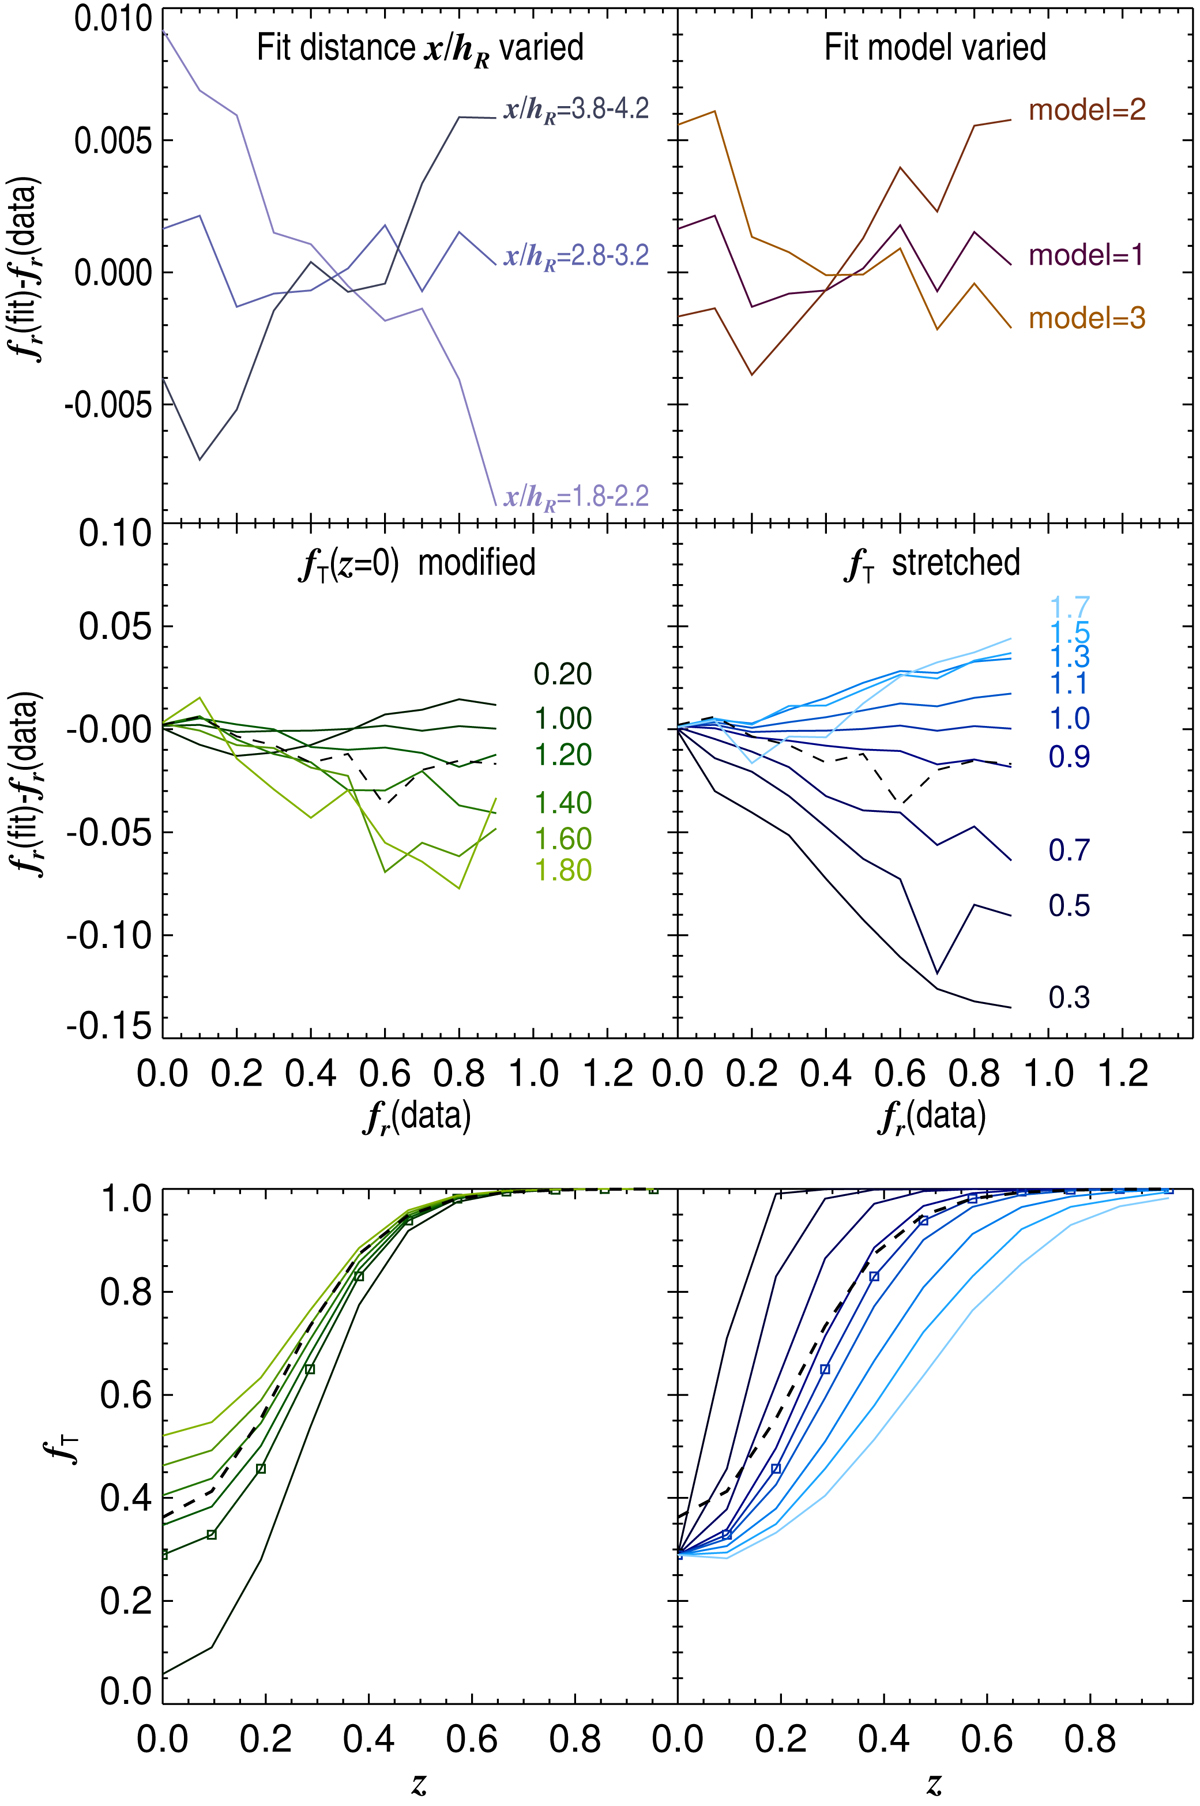
Various factors affecting the error between the actual input fraction of retrograde thick-disc stars in the N-body model, and the fraction returned by the fit. Upper left panel: fits with Eq. (20), using data from various axial distance intervals as indicated by the labels. Upper right panel: different variants of Eq. (20) are tested, using the data from the axial interval x/hR = 2.8 − 3.2: compared to the nominal case (“model=1”), in “model=2” the latter term in Eq. (20) has been omitted, while for “model=3” the ![]() has been replaced with
has been replaced with ![]() , to correct for the contamination of LOS-velocity dispersions by systematic velocities. The middle panels (notice the change in the y-axis range) show the effect of using an incorrect fraction for thick disc, illustrated in the corresponding panel in the lowermost row. In the left panel frame the shape of fT is retained, but the contribution of the thick disc in the equatorial plane has been multiplied with a factor indicated by the labels. In the right panel frame, the fT profile has been stretched/dilated in the vertical direction by the amount indicated by the labels. The dashed lines indicated the fit obtained using the fT estimated from a photometric thin-thick disc decomposition to the simulation data.
, to correct for the contamination of LOS-velocity dispersions by systematic velocities. The middle panels (notice the change in the y-axis range) show the effect of using an incorrect fraction for thick disc, illustrated in the corresponding panel in the lowermost row. In the left panel frame the shape of fT is retained, but the contribution of the thick disc in the equatorial plane has been multiplied with a factor indicated by the labels. In the right panel frame, the fT profile has been stretched/dilated in the vertical direction by the amount indicated by the labels. The dashed lines indicated the fit obtained using the fT estimated from a photometric thin-thick disc decomposition to the simulation data.
Current usage metrics show cumulative count of Article Views (full-text article views including HTML views, PDF and ePub downloads, according to the available data) and Abstracts Views on Vision4Press platform.
Data correspond to usage on the plateform after 2015. The current usage metrics is available 48-96 hours after online publication and is updated daily on week days.
Initial download of the metrics may take a while.