Fig. 2.
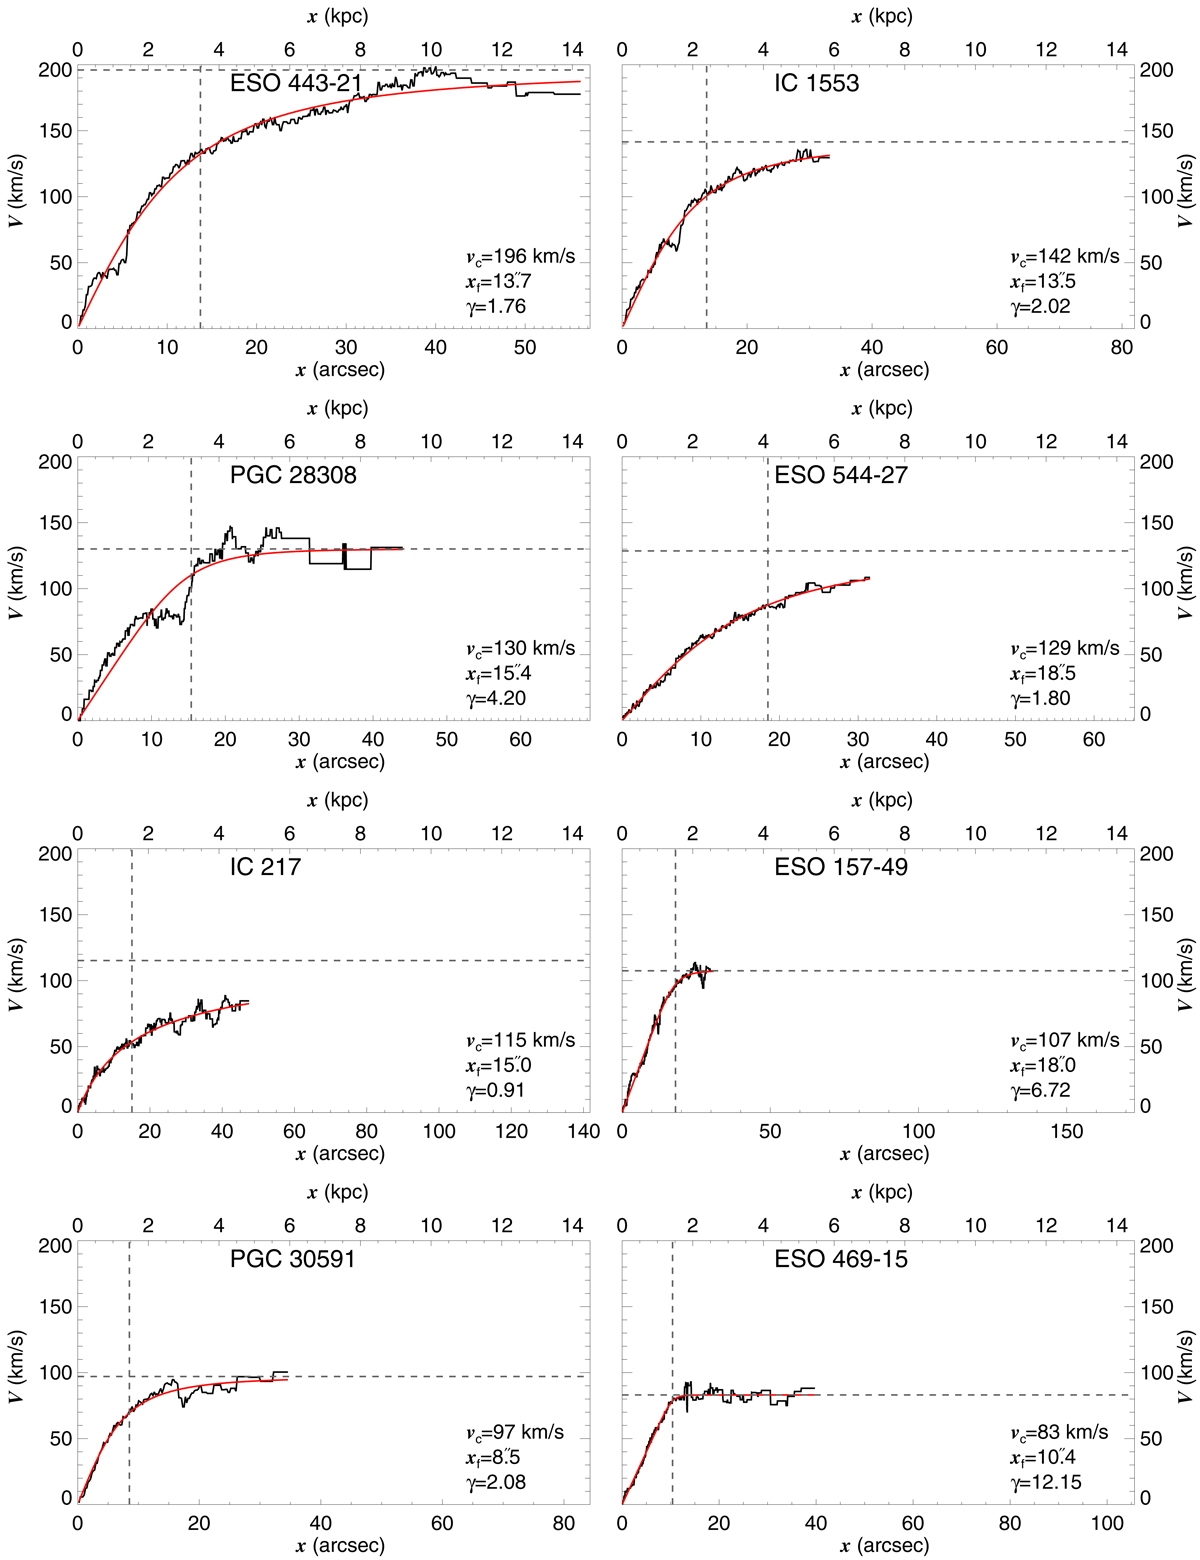
Symmetrised midplane rotation curves extracted from the line emission velocity maps in Figs. A.1–A.8 (black line) and their fit with Eq. (2) (red line). All panels cover the same physical scale (horizontal axis) and the same velocity scale (vertical axis). The lower-right corner of each panel shows the best fit parameters where vc is the circular velocity, xf is the axial coordinate of the flattening of the rotation curve, and γ describes the sharpness of the transition between a rising and the flat sections. The horizontal dashed lines indicate vc and the vertical dashed lines indicate xf. The panels are ordered by descending vc.
Current usage metrics show cumulative count of Article Views (full-text article views including HTML views, PDF and ePub downloads, according to the available data) and Abstracts Views on Vision4Press platform.
Data correspond to usage on the plateform after 2015. The current usage metrics is available 48-96 hours after online publication and is updated daily on week days.
Initial download of the metrics may take a while.