Fig. 3.
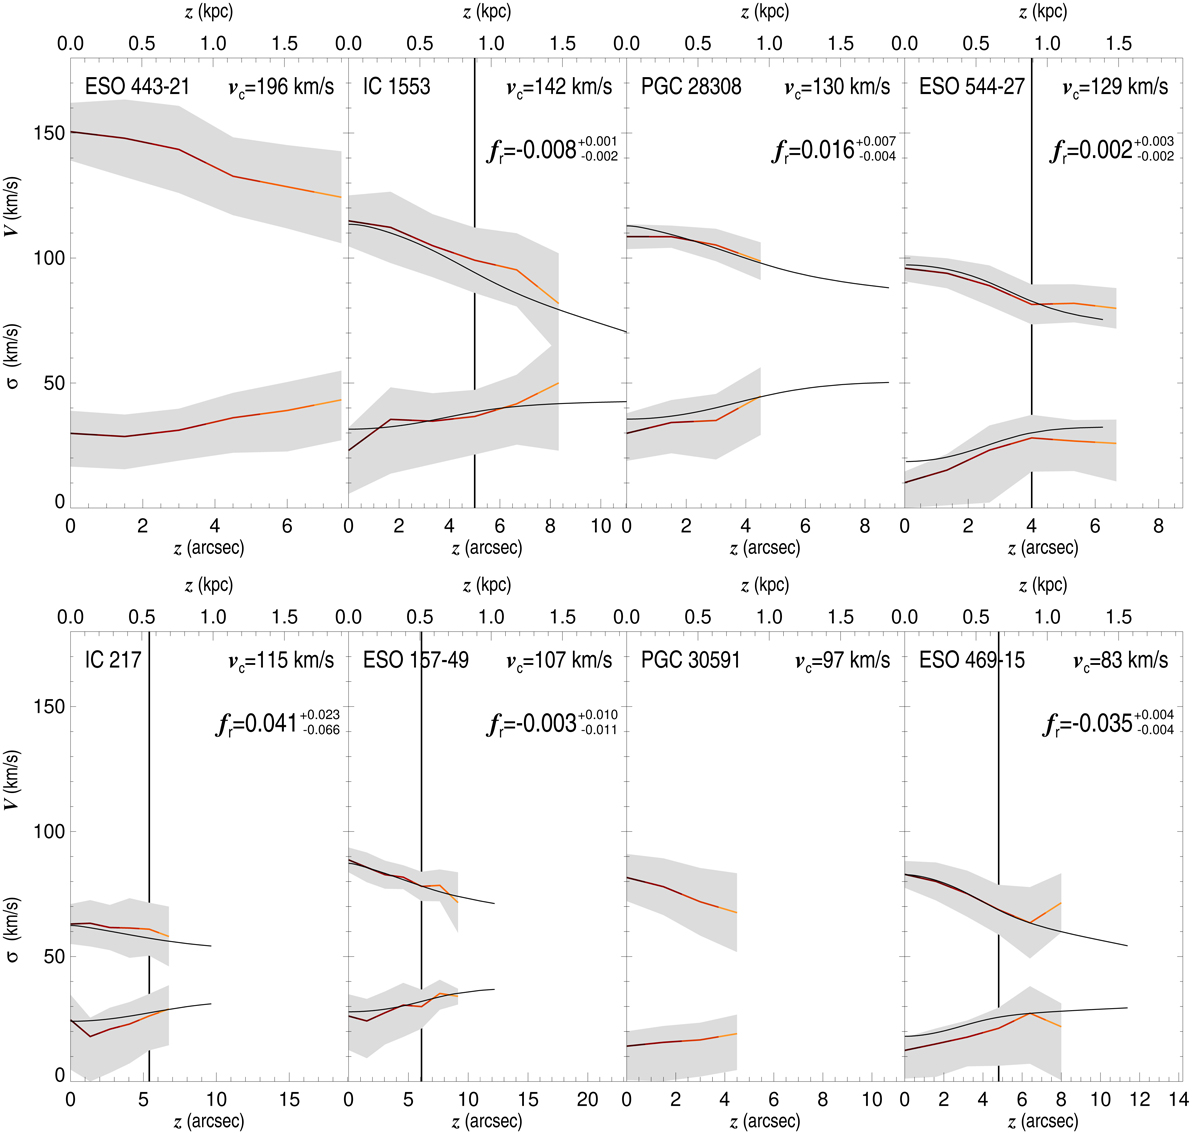
Symmetrised velocity and velocity dispersion as a function of height (red-orange lines) for the regions at x > 1.3 xf. The plots are ordered by descending maximum circular velocity at a height z = 0 as calculated from the parametrisation of the midplane gas rotation curves (Fig. 2 and Table 1). The grey bands correspond to the standard deviations of velocities and velocity dispersions at the bins used to obtain each point in the curves. The vertical solid lines show the height where the thick disc starts to dominate, if applicable to the galaxy. The black curves indicate fits to the velocity and velocity dispersion maps obtained with the formalism presented in Sect. 5.3 for the galaxies that have two discs. For these fits the non-convolved vertical profiles from photometric decompositions of Comerón et al. (2018) were adopted and then convolved with the MUSE FWHM (Eqs. (21) and (22) and Table 3). The horizontal axes are set so they stretch the same vertical span for all galaxies (1.85 kpc). The vertical axis is also the same in all the panels.
Current usage metrics show cumulative count of Article Views (full-text article views including HTML views, PDF and ePub downloads, according to the available data) and Abstracts Views on Vision4Press platform.
Data correspond to usage on the plateform after 2015. The current usage metrics is available 48-96 hours after online publication and is updated daily on week days.
Initial download of the metrics may take a while.