Fig. 4.
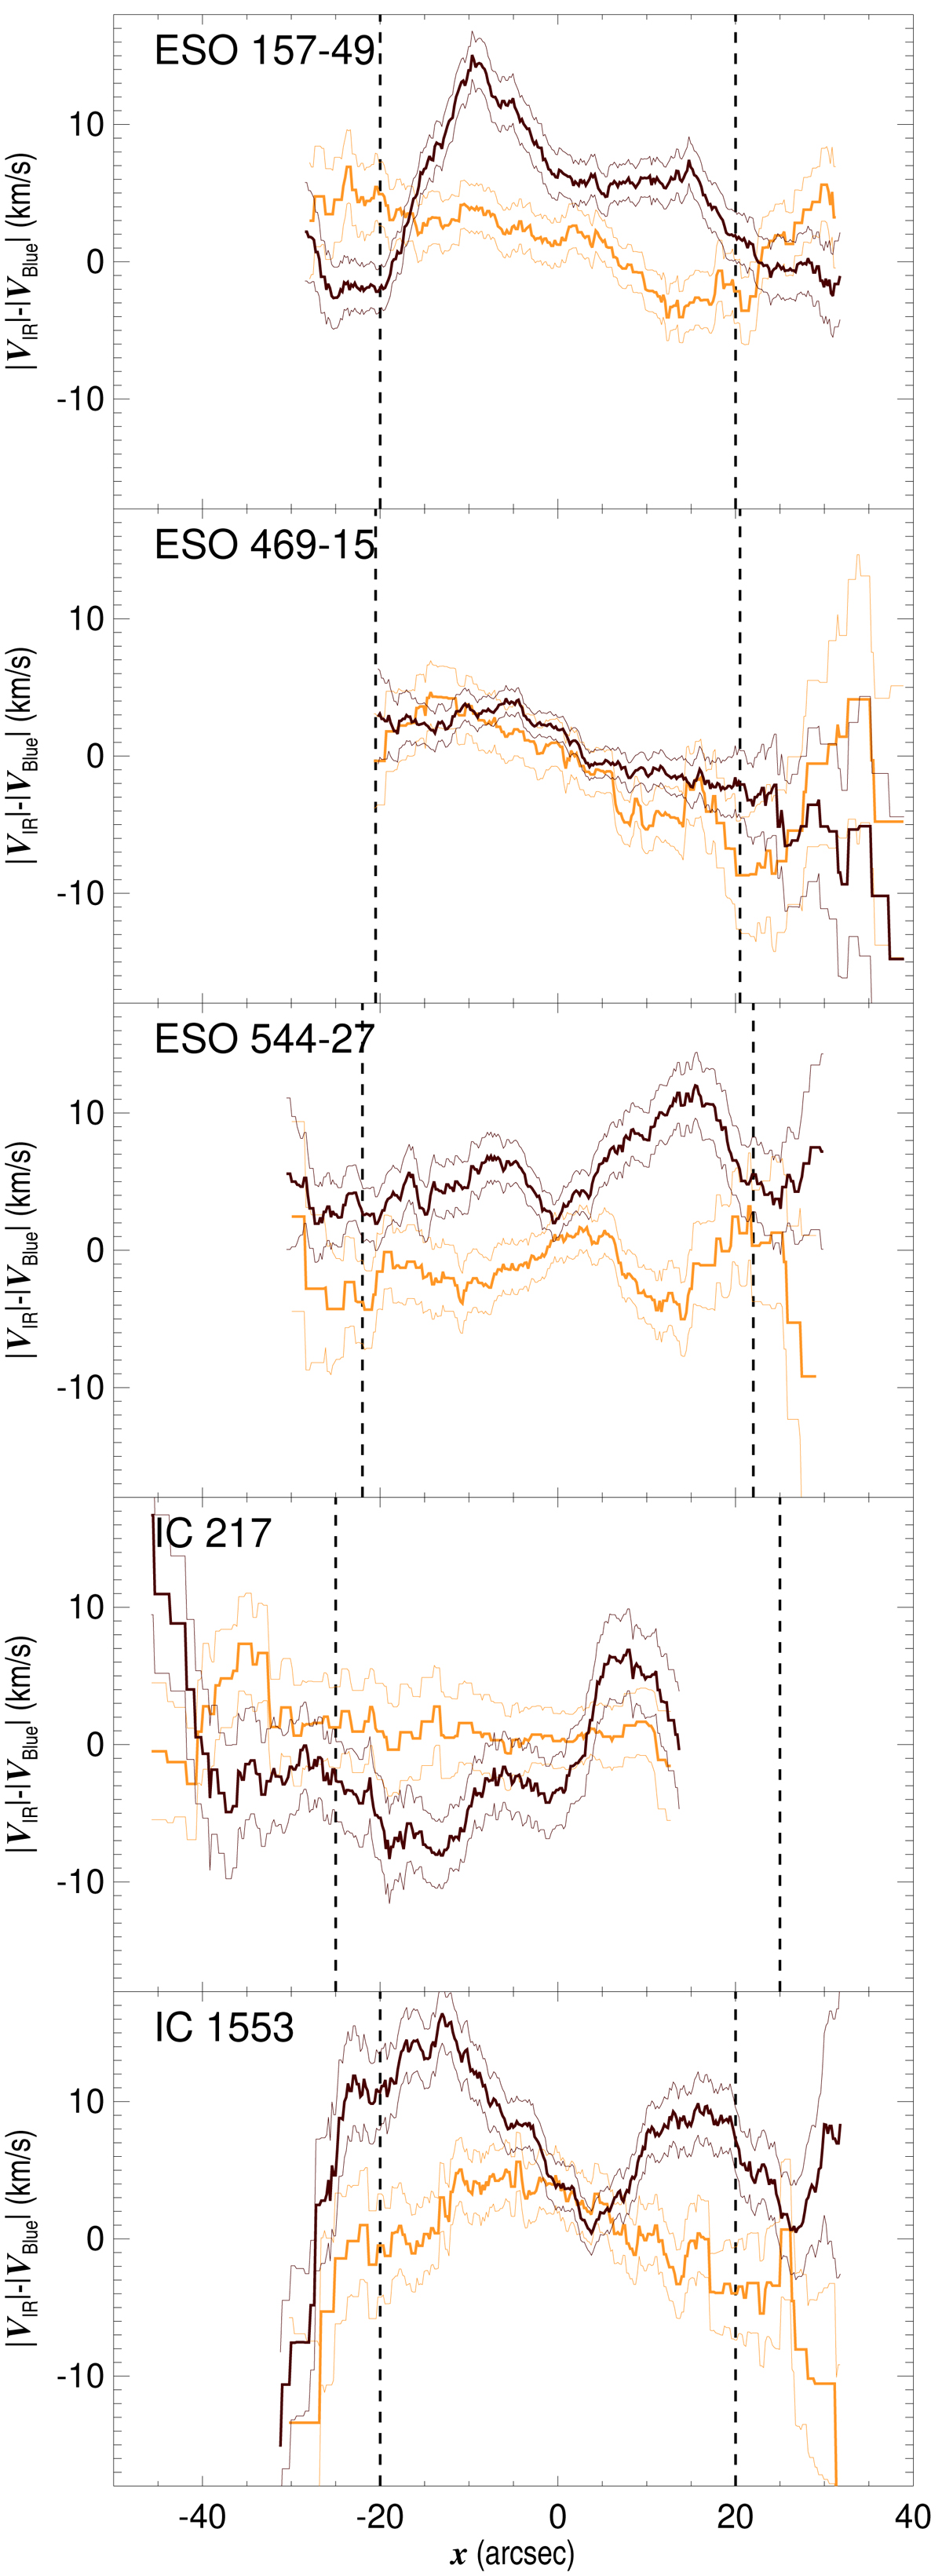
Difference between the absolute infrared and blue rotation velocities at the midplane (thick dark red line) and the height where the thick-disc light starts to dominate (thick yellow line). Uncertainty intervals are indicated by the thin lines. The position at which x = 1.3 xf is indicated with dashed lines. Only the galaxies for which the thick-disc light dominates a height range are shown. The curves have been smoothed with an 8″ window.
Current usage metrics show cumulative count of Article Views (full-text article views including HTML views, PDF and ePub downloads, according to the available data) and Abstracts Views on Vision4Press platform.
Data correspond to usage on the plateform after 2015. The current usage metrics is available 48-96 hours after online publication and is updated daily on week days.
Initial download of the metrics may take a while.