Fig. 6.
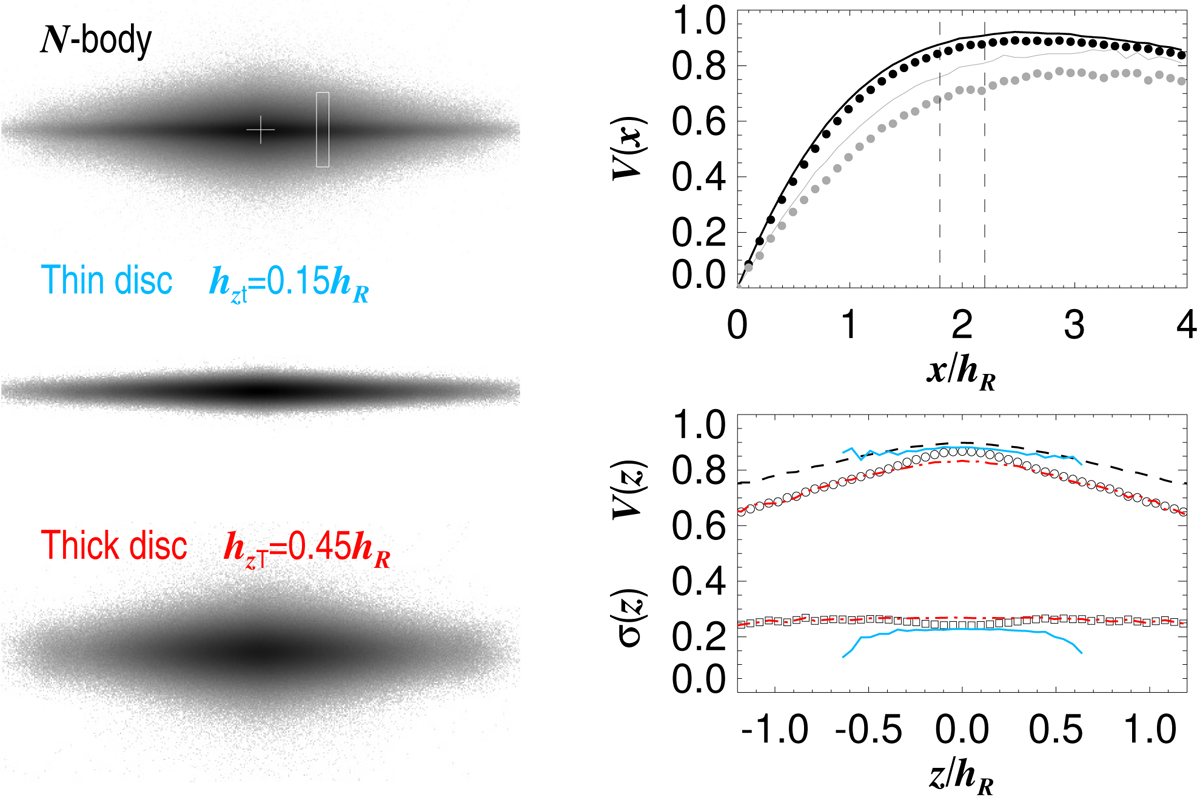
Illustration of the N-body model used for checking the method for extracting the fraction of retrograde thick-disc stars. Upper left panel: frame edge-on snapshot of the simulated disc, while the other two frames display the thin and thick components separately (each with 106 particles). Upper right frame: combined LOS-averaged rotation curves: black and grey lines correspond to the circular velocities at z/hR = 0 and 0.9, respectively, while the circles indicate the same for stars. Lower right frame: combined vertical velocity and velocity dispersion profiles, averaged over the radial range 1.8 − 2.2 hR, indicated by the white box on the N-body snapshot. The dashed line stands for the circular velocity, open circles for ![]() , and squares for σ. The continuous blue and dash-dot red curves show
, and squares for σ. The continuous blue and dash-dot red curves show ![]() and σ for the thin and thick discs, respectively.
and σ for the thin and thick discs, respectively.
Current usage metrics show cumulative count of Article Views (full-text article views including HTML views, PDF and ePub downloads, according to the available data) and Abstracts Views on Vision4Press platform.
Data correspond to usage on the plateform after 2015. The current usage metrics is available 48-96 hours after online publication and is updated daily on week days.
Initial download of the metrics may take a while.