Fig. 4.
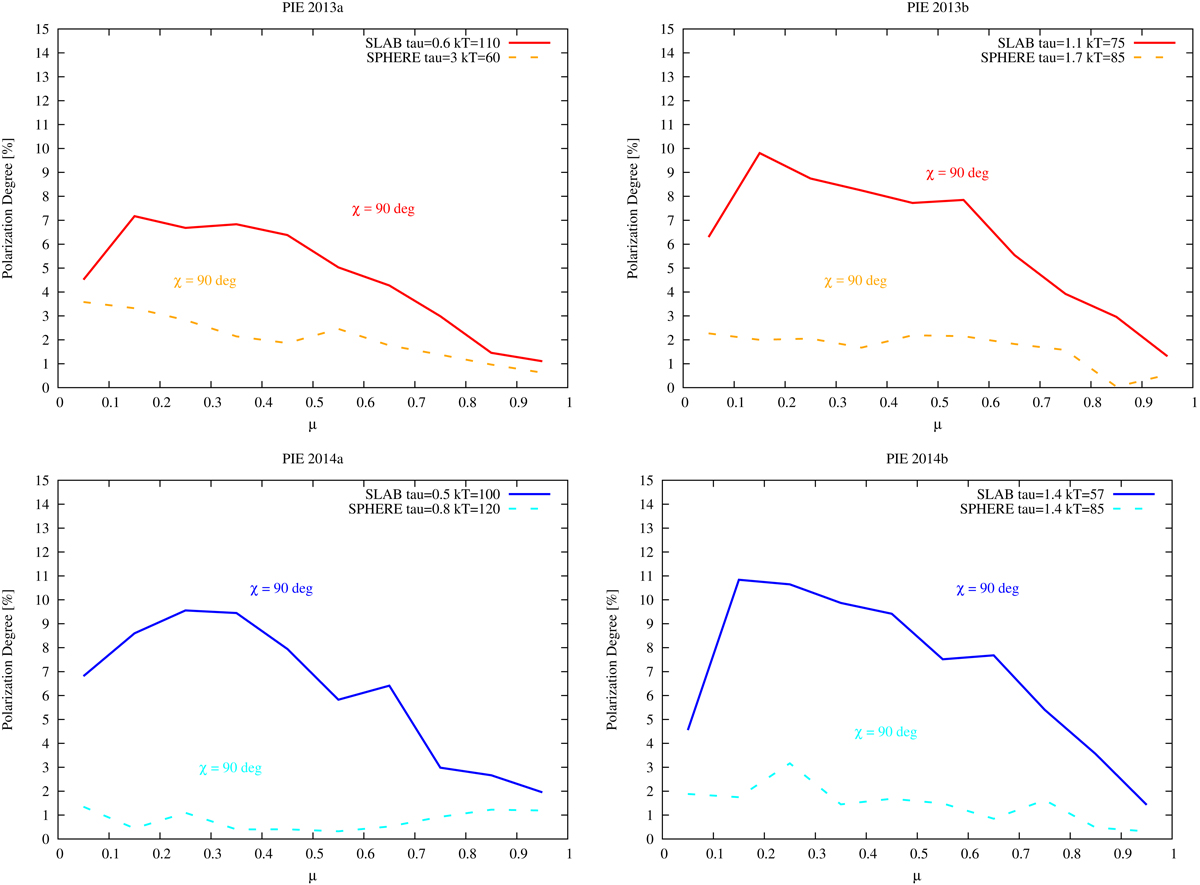
Polarization degree versus the cosine of the inclination angle μ are shown after integrating the signal in the IXPE operating band (2–8 keV), for the 2013 (top panels) and 2014 (bottom panels) cases and for both extended slab and spherical geometries. Left panels show simulations in which the input kTe and τ correspond to best fit values, while we took into account statistically equivalent parameters (i.e. corresponding to relative minima in the fits, see Fig. 3) in the right panels.
Current usage metrics show cumulative count of Article Views (full-text article views including HTML views, PDF and ePub downloads, according to the available data) and Abstracts Views on Vision4Press platform.
Data correspond to usage on the plateform after 2015. The current usage metrics is available 48-96 hours after online publication and is updated daily on week days.
Initial download of the metrics may take a while.