Fig. B.1
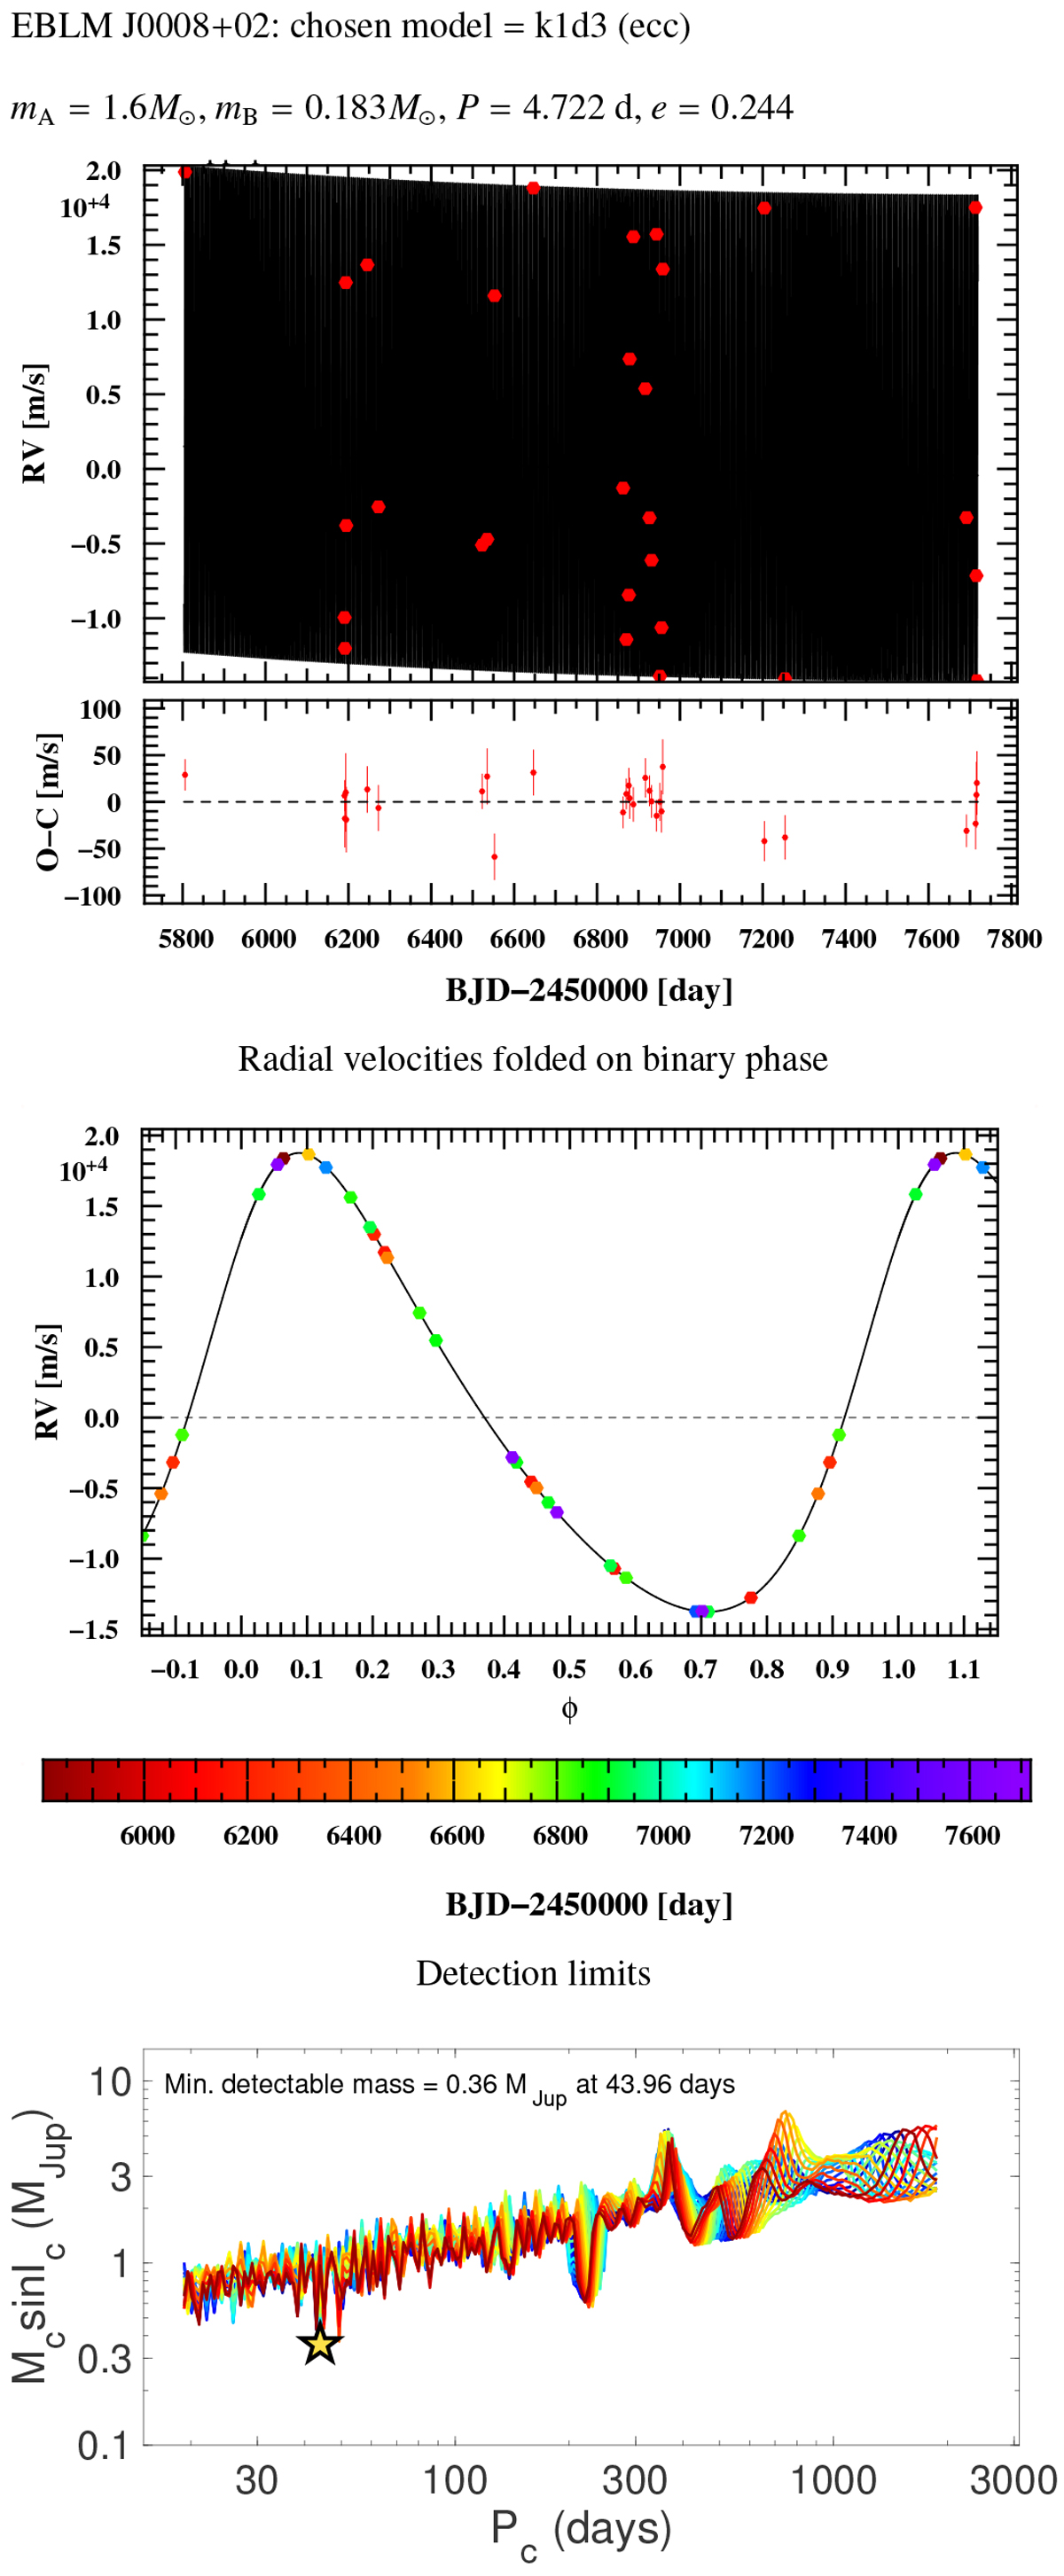
Top panel: radial velocity measurements over time (red) and fitted model (black) and the residuals to the model fit (O–C). Middle panel: phase-folded velocities on the binary period, where the colour indicates the observationdate. Bottom panel: detection limits as a function of the detectable tertiary period and minimum mass, where different colours are used for 20 different tested tertiary orbital phases uniformly sampled over 360°, and the yellow star highlights the smallest detectable mass for any parameters.
Current usage metrics show cumulative count of Article Views (full-text article views including HTML views, PDF and ePub downloads, according to the available data) and Abstracts Views on Vision4Press platform.
Data correspond to usage on the plateform after 2015. The current usage metrics is available 48-96 hours after online publication and is updated daily on week days.
Initial download of the metrics may take a while.