Fig. 2.
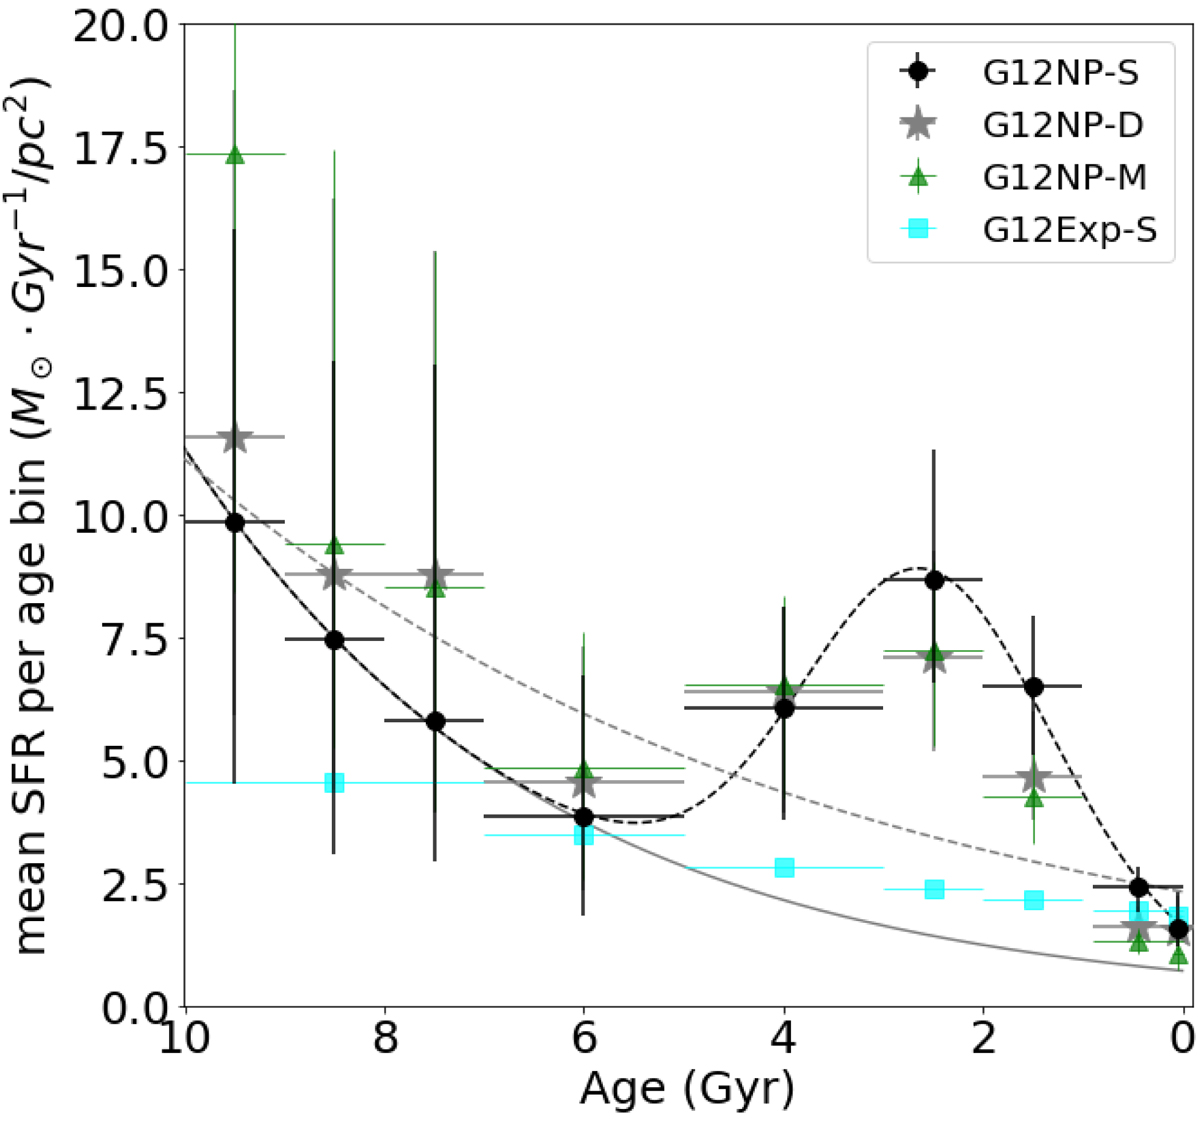
Most probable values of the mean SFR for the age bin obtained from the posterior PDF. The vertical error bars indicate the 0.16 and 0.84 quantiles of the posterior PDF. The horizontal error bars indicate the size of the age bin. The grey and black dashed lines are, respectively, an exponential function and a distribution formed by a bounded exponential plus a Gaussian, fitted to the G12NP-S results. The grey solid line is the exponential part of this exponential plus Gaussian fit. See Table 2 for details of the SFH and extinction maps used.
Current usage metrics show cumulative count of Article Views (full-text article views including HTML views, PDF and ePub downloads, according to the available data) and Abstracts Views on Vision4Press platform.
Data correspond to usage on the plateform after 2015. The current usage metrics is available 48-96 hours after online publication and is updated daily on week days.
Initial download of the metrics may take a while.