Fig. 5.
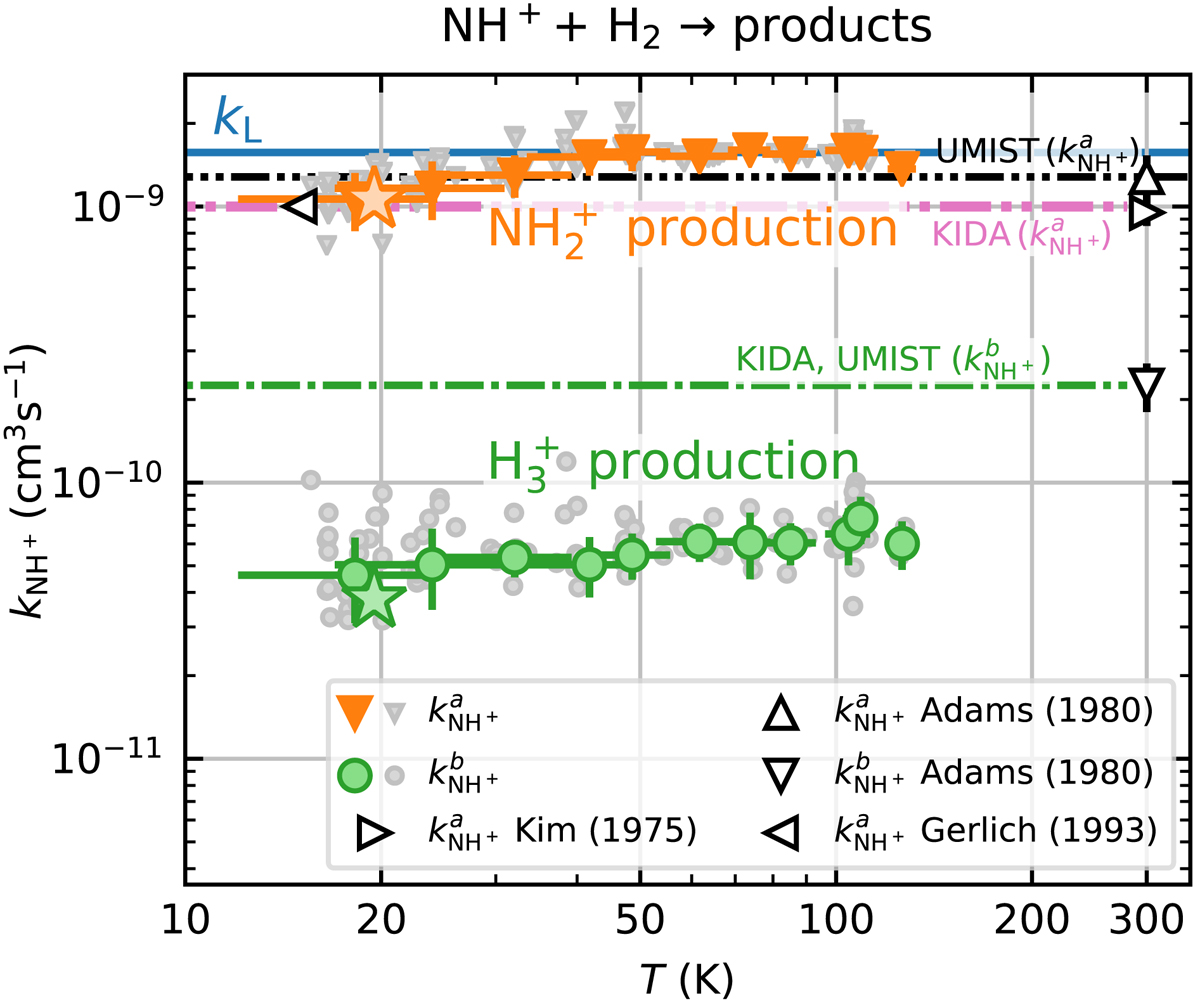
Measured temperature dependences of the reaction rate coefficients ![]() and
and ![]() of the reactions (3a) and (3b), respectively. The data were binned and averaged for presentation. The raw data without binning are indicated with the smaller points. The stars (at 20 K) indicate the reaction rate coefficients obtained from the dependences of
of the reactions (3a) and (3b), respectively. The data were binned and averaged for presentation. The raw data without binning are indicated with the smaller points. The stars (at 20 K) indicate the reaction rate coefficients obtained from the dependences of ![]() and
and ![]() on [H2] (Fig. 4). The horizontal solid line (kL) indicates the value of the Langevin collisional rate coefficient. Results of Kim et al. (1975), Adams et al. (1980), and Gerlich (1993) are indicated with the open symbols. The values taken from the KIDA (Wakelam et al. 2012) and UMIST (McElroy et al. 2013) databases are also plotted.
on [H2] (Fig. 4). The horizontal solid line (kL) indicates the value of the Langevin collisional rate coefficient. Results of Kim et al. (1975), Adams et al. (1980), and Gerlich (1993) are indicated with the open symbols. The values taken from the KIDA (Wakelam et al. 2012) and UMIST (McElroy et al. 2013) databases are also plotted.
Current usage metrics show cumulative count of Article Views (full-text article views including HTML views, PDF and ePub downloads, according to the available data) and Abstracts Views on Vision4Press platform.
Data correspond to usage on the plateform after 2015. The current usage metrics is available 48-96 hours after online publication and is updated daily on week days.
Initial download of the metrics may take a while.