Fig. 1.
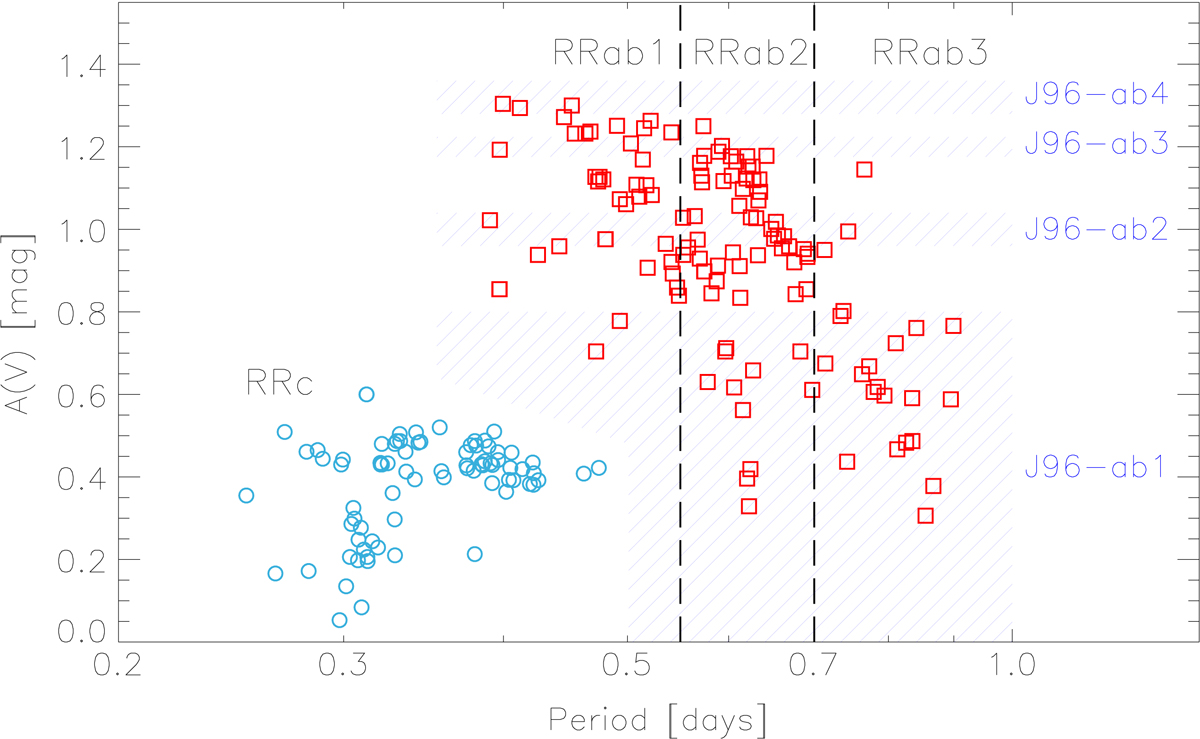
Bailey diagram, V-band amplitude versus period, for ω Cen RRLs. Blue circles mark RRc variables, while red squares mark RRab variables. The ranges in period for the RRab light-curve templates are indicated by vertical black dashed lines. The blue striped areas show the ranges in amplitude adopted for the light-curve templates by J96. Note that they provided thresholds in the B band, but here they have been rescaled by 1.25, i.e., the typical amplitude ratio (A(B)/A(V)) for RRab variables (Braga et al. 2016).
Current usage metrics show cumulative count of Article Views (full-text article views including HTML views, PDF and ePub downloads, according to the available data) and Abstracts Views on Vision4Press platform.
Data correspond to usage on the plateform after 2015. The current usage metrics is available 48-96 hours after online publication and is updated daily on week days.
Initial download of the metrics may take a while.