Fig. 10.
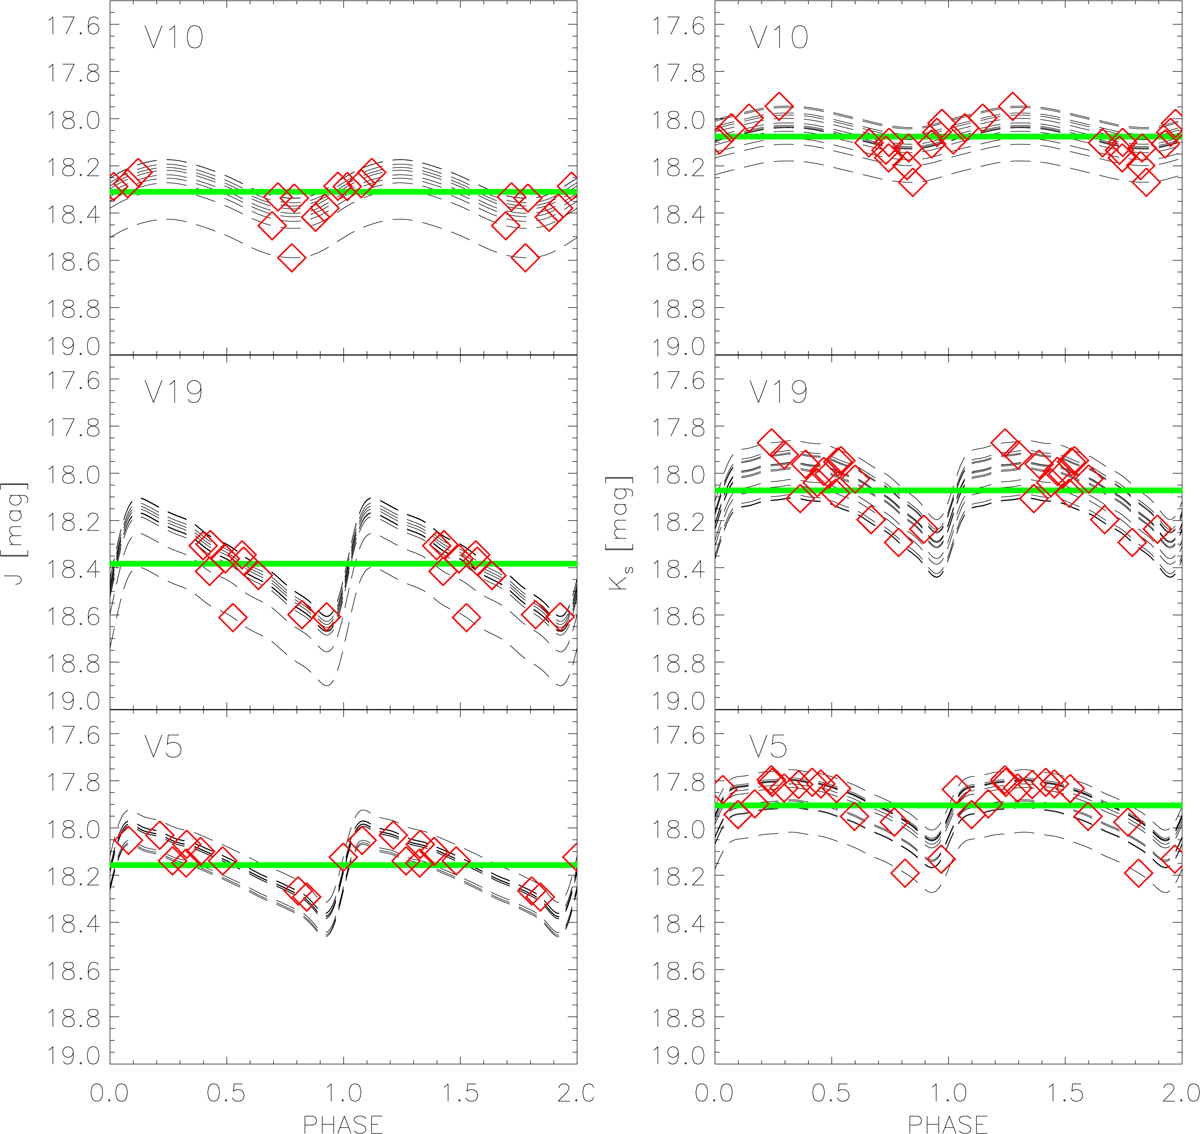
Top: J (left panel) and Ks (right panel) band light curve for the RRc variable V10. The red diamonds display the binned phase points. The black dashed curves show the light-curve template applied to the individual binned phase points. The thick green line displays the mean magnitude listed in Table 11. Middle: same as the top panel, but for the RRab variable V19. Bottom: same as top panel, but for the RRab variable V5.
Current usage metrics show cumulative count of Article Views (full-text article views including HTML views, PDF and ePub downloads, according to the available data) and Abstracts Views on Vision4Press platform.
Data correspond to usage on the plateform after 2015. The current usage metrics is available 48-96 hours after online publication and is updated daily on week days.
Initial download of the metrics may take a while.