Fig. 11.
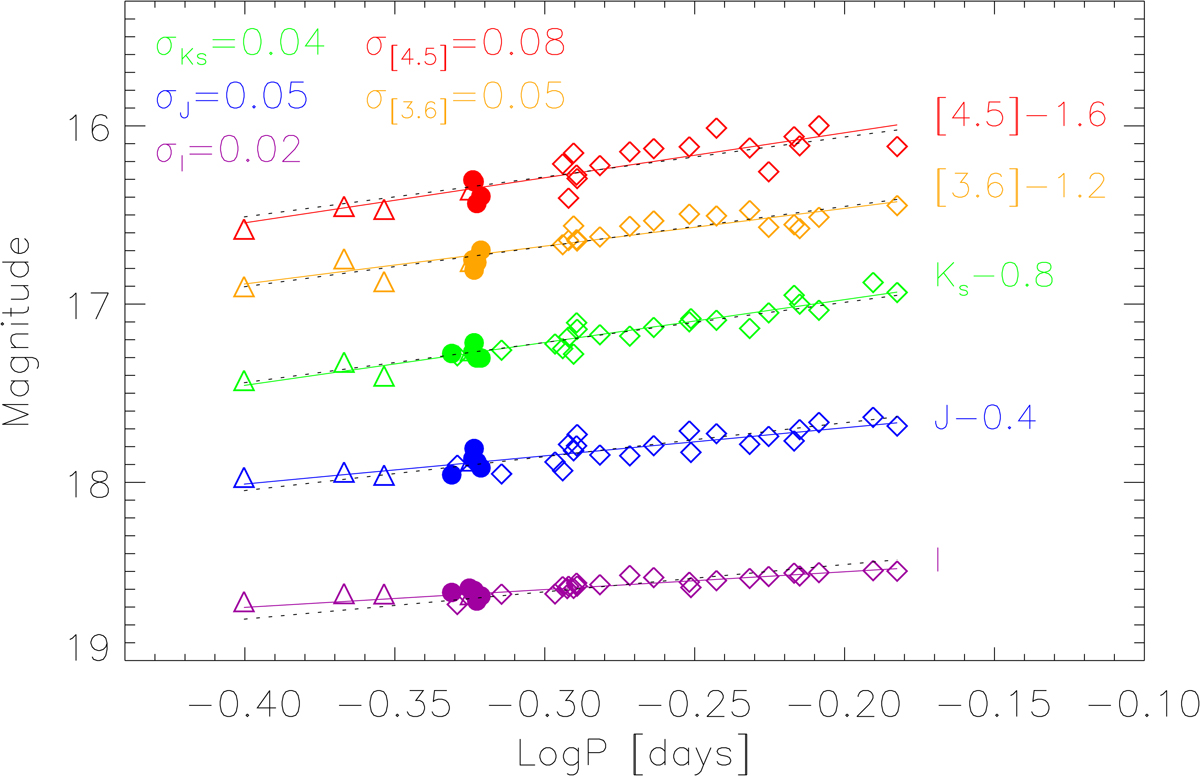
I-, J-, Ks- [3.6]- and [4.5]-band PL relations of Reticulum RRLs. Diamonds display RRab variables, triangles RRc variables and circles the RRd variables. Purple, blue, green, orange, and red symbols display the un-reddened mean magnitudes in the I, J, Ks, [3.6] and [4.5] bands, respectively. The J, Ks, [3.6] and [4.5] magnitudes were artificially shifted by –0.4, –0.8, –1.2 and –1.6 mag for more clarity. The solid lines display the empirical PL relations (Eqs. (8)–(12)). The dashed black lines display the theoretical PLZ relations by Marconi et al. (2015), Neeley et al. (2017), at [Fe/H] = –1.70 (Suntzeff et al. 1992, transformed into the Carretta et al. 2009 metallicity scale) and artificially shifted in magnitude. The PLZI relation was only shifted for the current value of the true distance modulus. The standard deviation of the relations are labelled on the top-left corner.
Current usage metrics show cumulative count of Article Views (full-text article views including HTML views, PDF and ePub downloads, according to the available data) and Abstracts Views on Vision4Press platform.
Data correspond to usage on the plateform after 2015. The current usage metrics is available 48-96 hours after online publication and is updated daily on week days.
Initial download of the metrics may take a while.