Fig. 7.
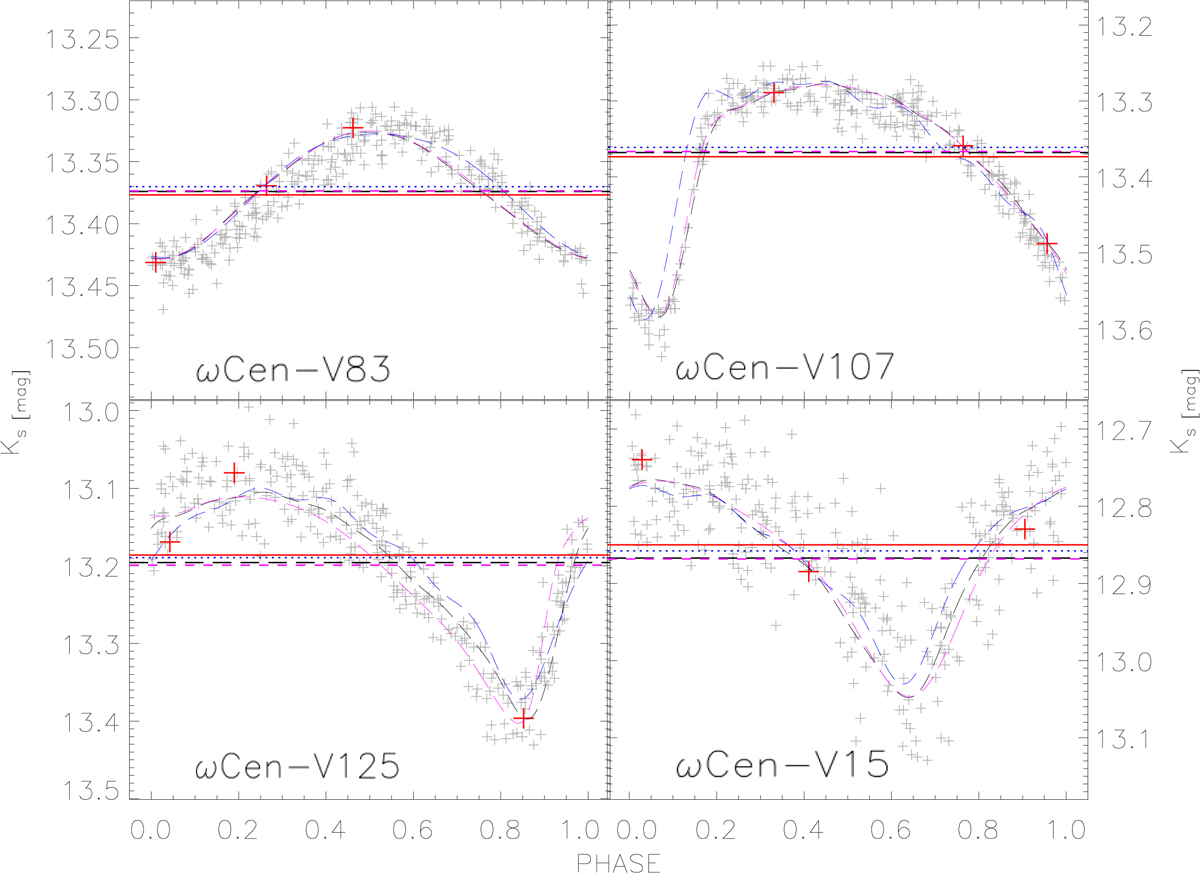
Top-left: Fourier, PEGASUS and J96 template fits applied to RRc variable ωCen-V83. Grey crosses show the randomly extracted phase points. The red crosses display the three phase points of a single random extraction. The horizontal red line shows the mean magnitude of the variable based on the flux average fit of the empirical data. The black dashed curve and the horizontal black long-dashed line show the fit with the Fourier template and its mean magnitude. The magenta dashed curve and the horizontal magenta long-dashed line display the same, but for the PEGASUS fit. The blue dotted curve and the horizontal blue dotted line display the same, but for the J96 fit. Top-right: Same as the top-left, but for the RRab variable ωCen-V107 (RRab1). Bottom-left: Same as the top-left, but for the RRab variable ωCen-V125 (RRab2). Bottom-right: Same as the top-left, but for the RRab variable ωCen-V15 (RRab3). We note that, in these panels, the light curves are not phased using tris, but to an arbitrary epoch (HJD = 2 350 000) to underline that the three phase points method is independent of the reference epoch.
Current usage metrics show cumulative count of Article Views (full-text article views including HTML views, PDF and ePub downloads, according to the available data) and Abstracts Views on Vision4Press platform.
Data correspond to usage on the plateform after 2015. The current usage metrics is available 48-96 hours after online publication and is updated daily on week days.
Initial download of the metrics may take a while.