Fig. 2
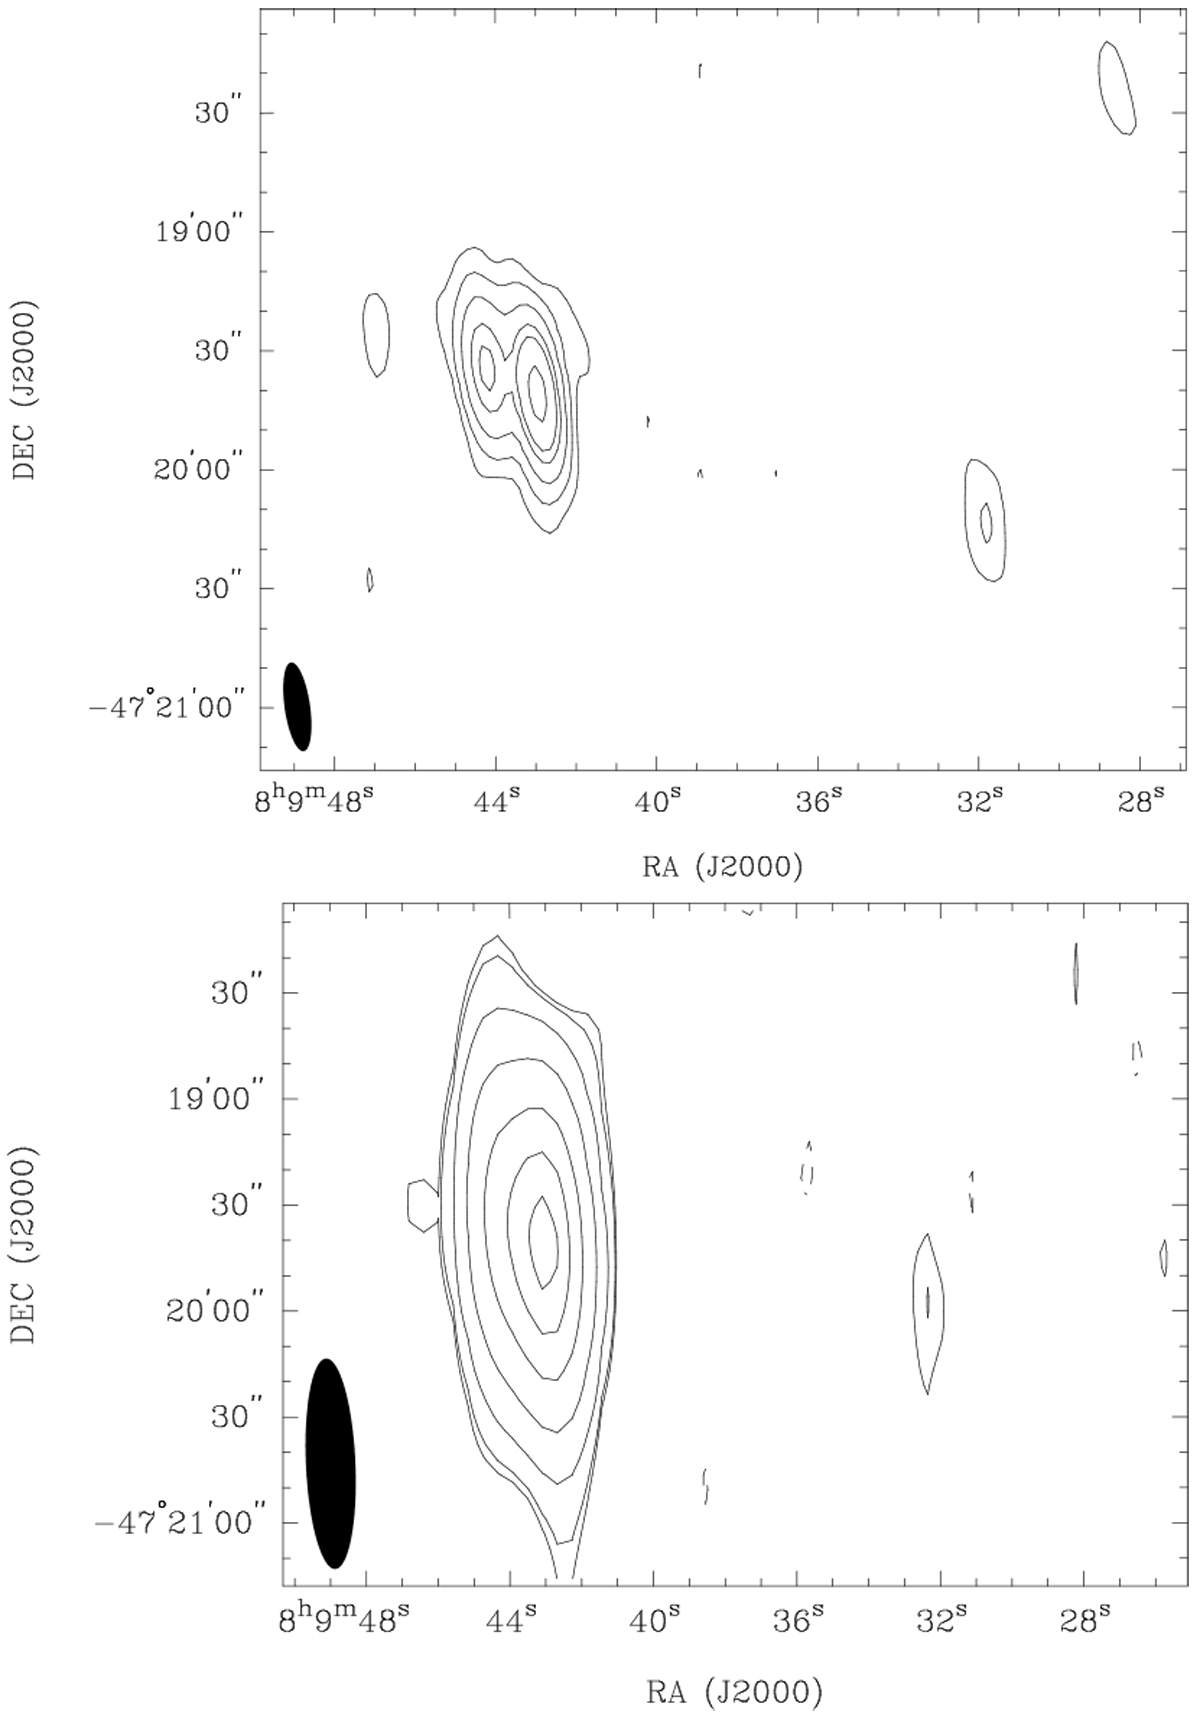
Continuum images of WR 11 and MOST 0808–471. Top: at 325 MHz; contour levels of ± 3, 10, 30, 80, 130, and 300σ, where σ = 0.2 mJy beam−1. The maxima, from right to left, correspond to sources I23 and I26 (double) of Table 5, respectively. Bottom: at 150 MHz; contour levels of ± 3, 4, 10, 30, 80, 150, and 220σ, where σ = 0.8 mJy beam−1. Synthesized beams are shown at the bottom left corner of each image.
Current usage metrics show cumulative count of Article Views (full-text article views including HTML views, PDF and ePub downloads, according to the available data) and Abstracts Views on Vision4Press platform.
Data correspond to usage on the plateform after 2015. The current usage metrics is available 48-96 hours after online publication and is updated daily on week days.
Initial download of the metrics may take a while.