Free Access
Fig. 5
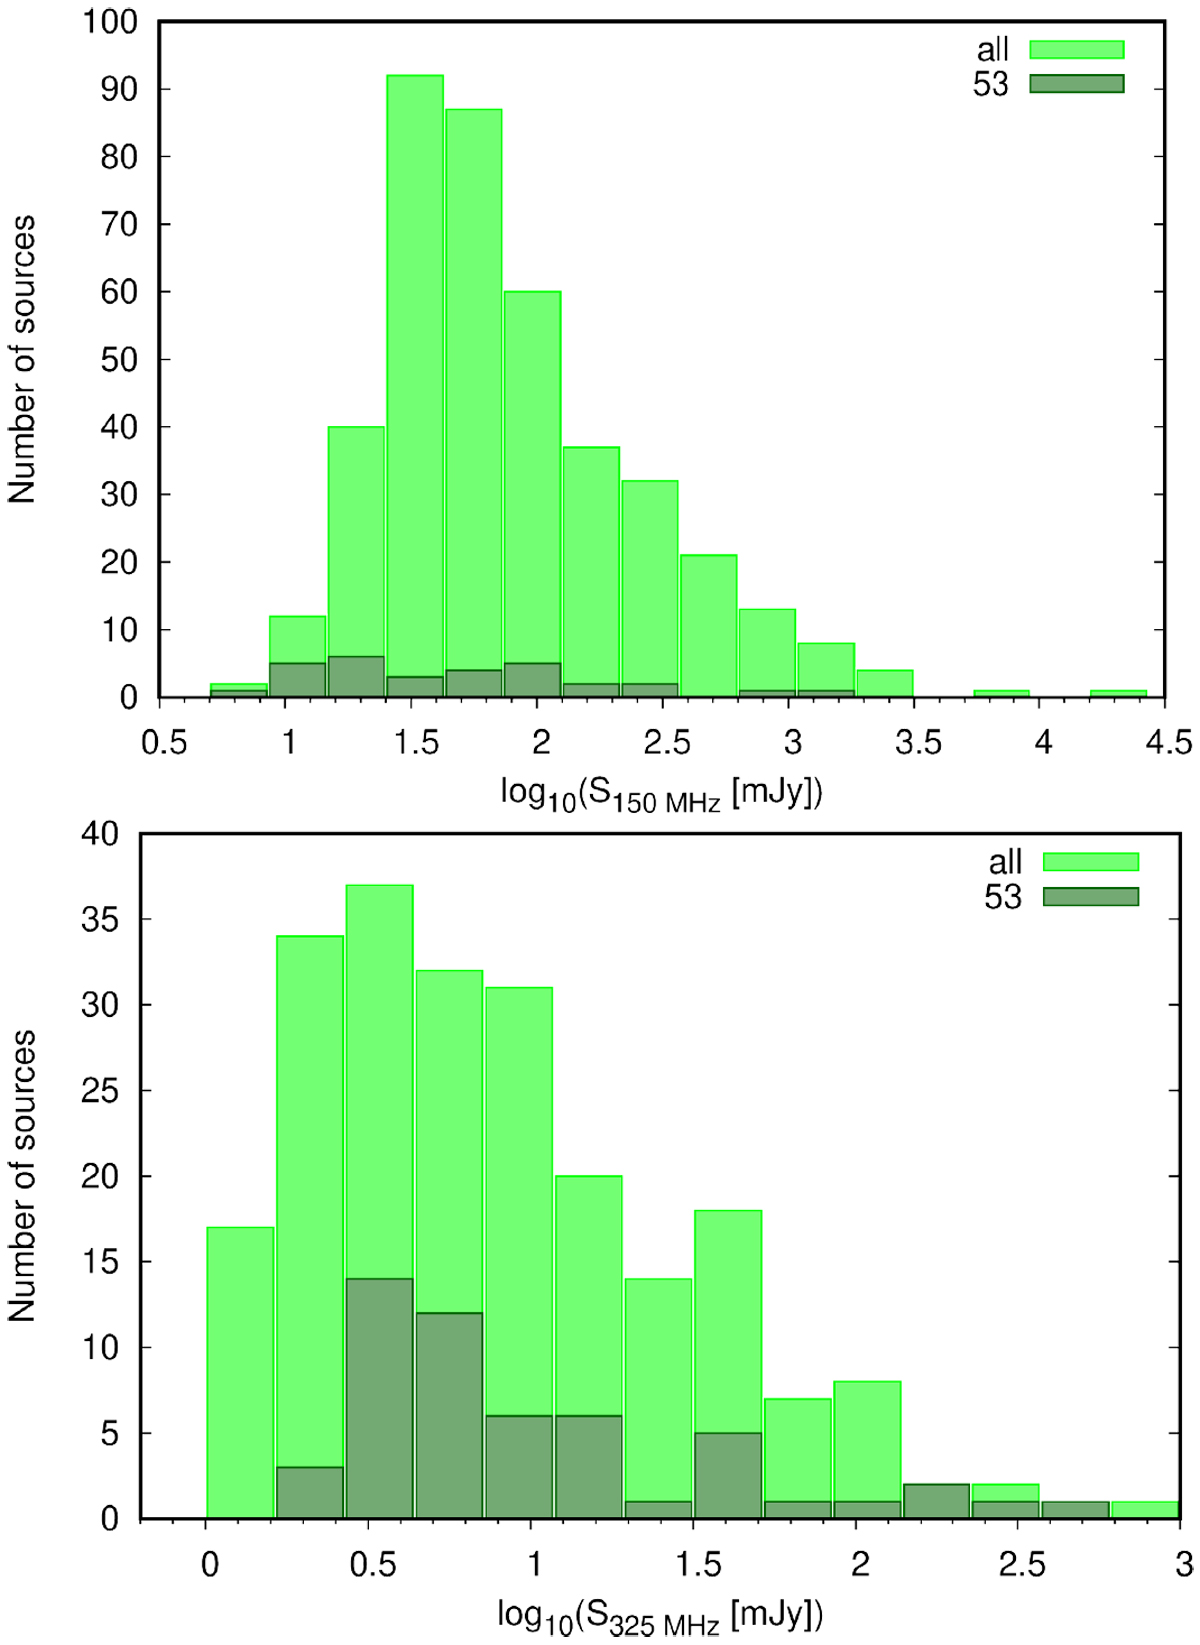
Histograms of fluxes. Top: sources at 150 MHz. Bottom: sources at 325 MHz. Light green boxes indicate the whole sample of sources detected at each wavelength, whereas in dark green the sample is restricted to the 53 sources described in Sect. 4.3.
Current usage metrics show cumulative count of Article Views (full-text article views including HTML views, PDF and ePub downloads, according to the available data) and Abstracts Views on Vision4Press platform.
Data correspond to usage on the plateform after 2015. The current usage metrics is available 48-96 hours after online publication and is updated daily on week days.
Initial download of the metrics may take a while.