Fig. 6
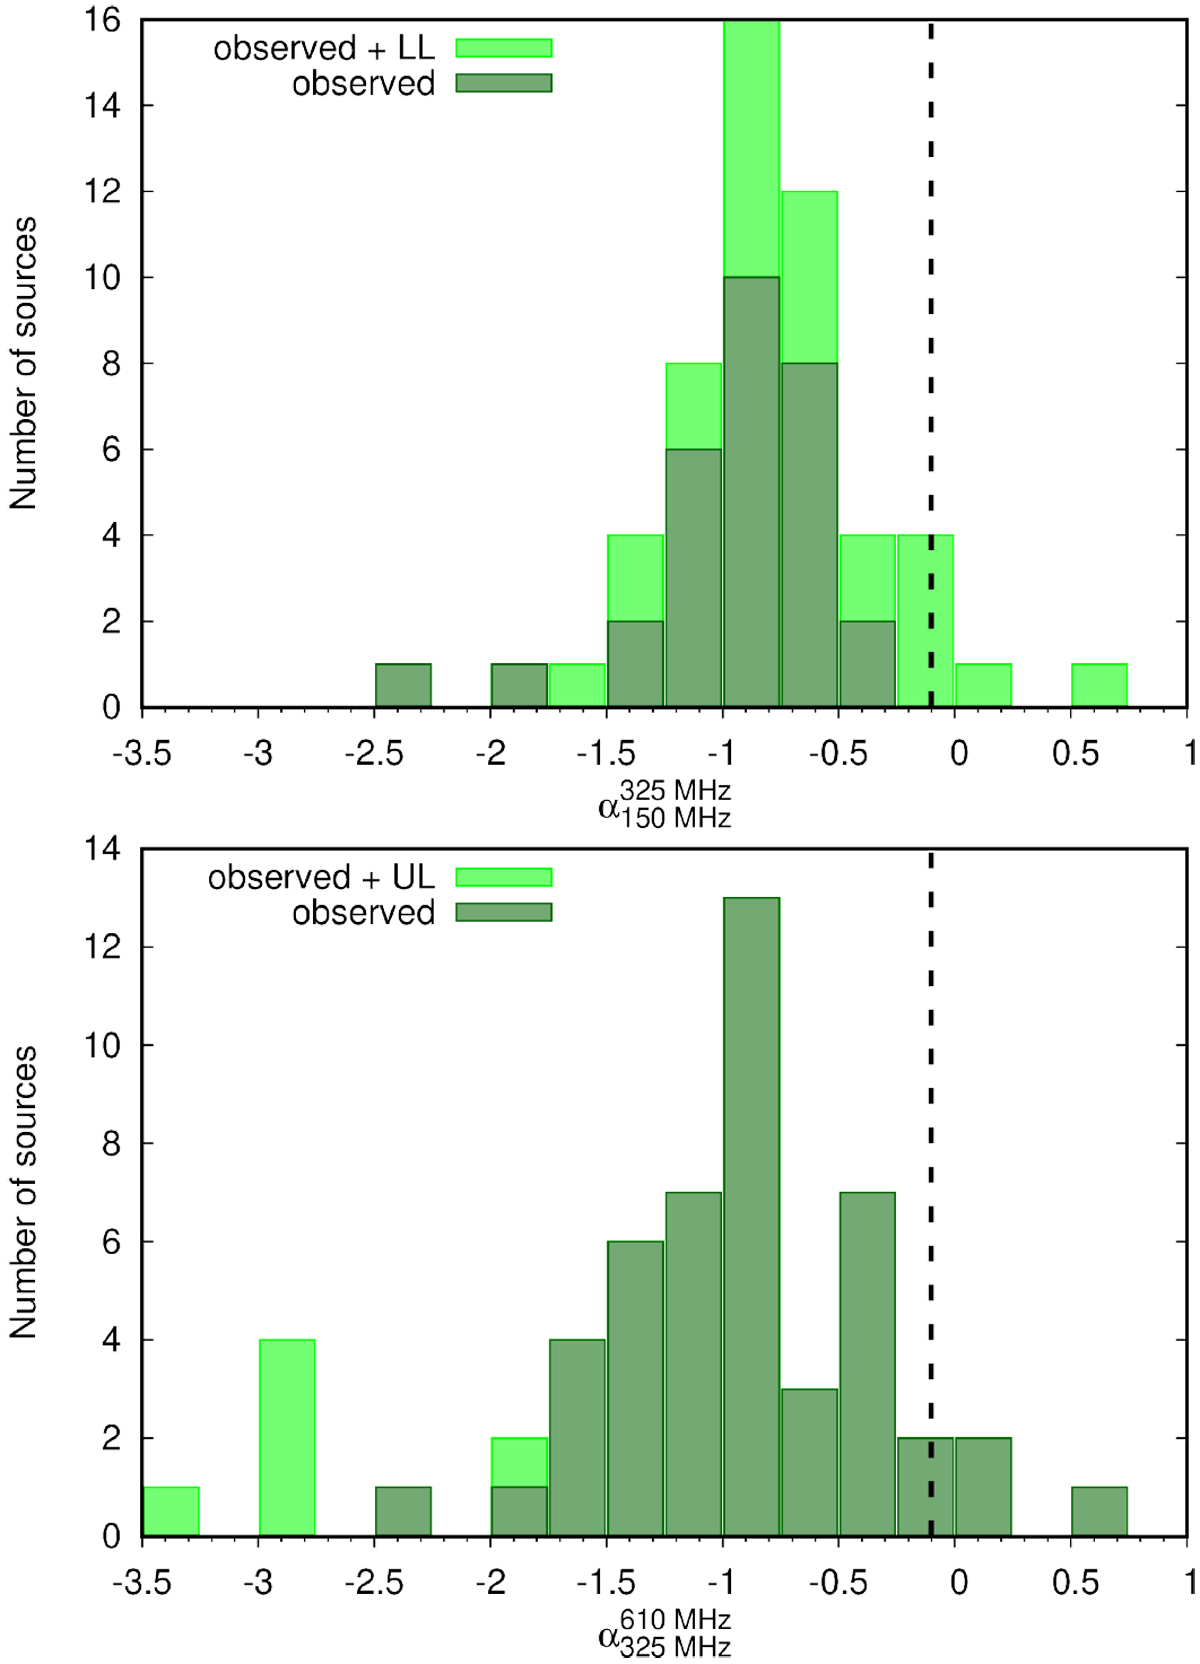
Histograms of spectral indices using the values reported in Table 5. The dashed vertical line denotes α = − 0.1, which is thelowest possible value for thermal emission. Top: between fluxes at 150 and 325 MHz; when only an UL to the flux at 150 MHz was available, we also estimated a lower limit (LL) to the spectral index. Bottom: between fluxes at 325 and 610 MHz; when only an UL to the flux at 610 MHz was available, we also estimated an UL to the spectral index.
Current usage metrics show cumulative count of Article Views (full-text article views including HTML views, PDF and ePub downloads, according to the available data) and Abstracts Views on Vision4Press platform.
Data correspond to usage on the plateform after 2015. The current usage metrics is available 48-96 hours after online publication and is updated daily on week days.
Initial download of the metrics may take a while.