Fig. 1
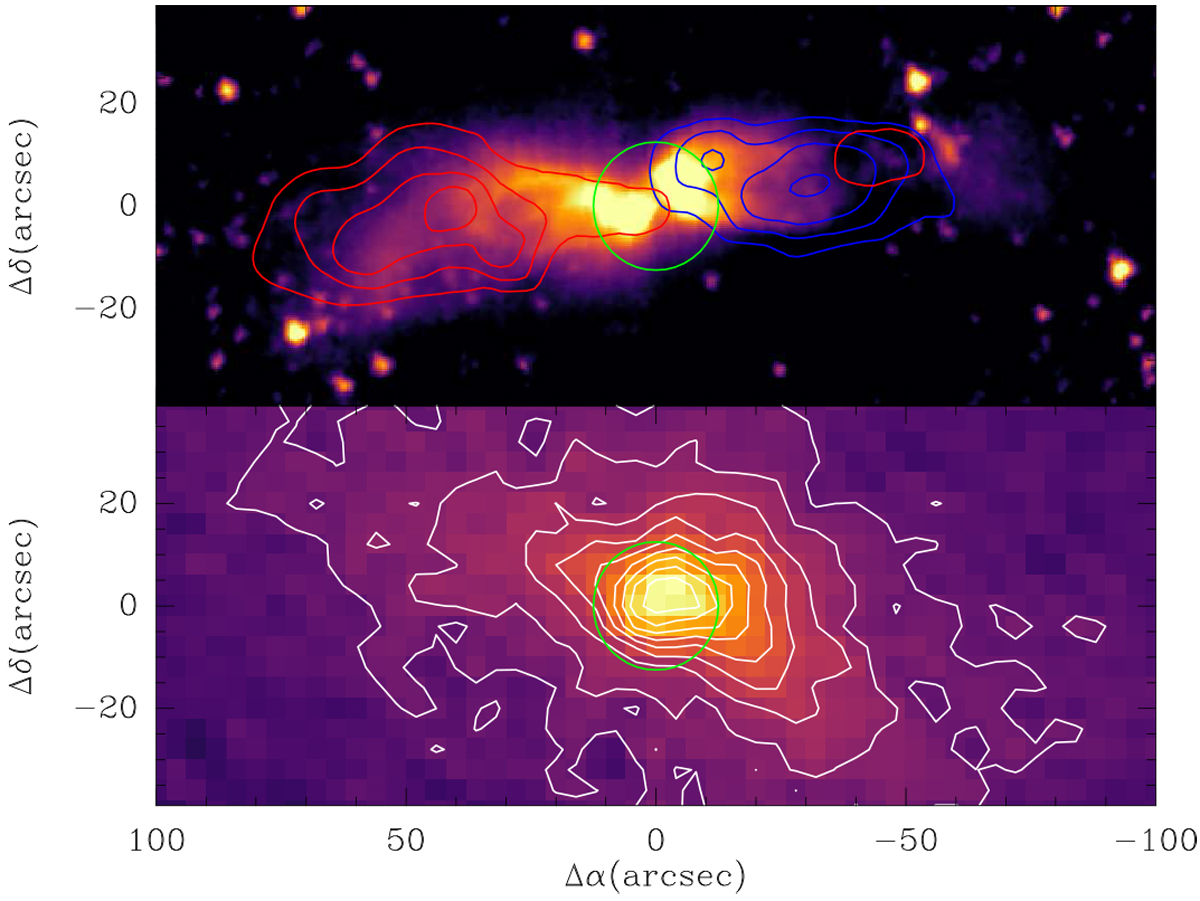
Upper panel: high-velocity CO J = (2–1) emission (red/blue contours correspond to red/blue-shifted velocities; from Tafalla et al. 2000) is shown superimposed on the 3.6 μm Spitzer/IRAC image. Lower panel: map of the λ1.3 mm dust continuum emission observed with MAMBO (Tafalla et al., unpublished data) is shown in both contours and color. First contour and contour interval are 20 mJy (11′′ -beam)−1. The green circle in both panels corresponds to a size of 25′′, representative of the region probed by the IRAM 30 m telescope in the λ3 mm band.
Current usage metrics show cumulative count of Article Views (full-text article views including HTML views, PDF and ePub downloads, according to the available data) and Abstracts Views on Vision4Press platform.
Data correspond to usage on the plateform after 2015. The current usage metrics is available 48-96 hours after online publication and is updated daily on week days.
Initial download of the metrics may take a while.