Fig. 2.
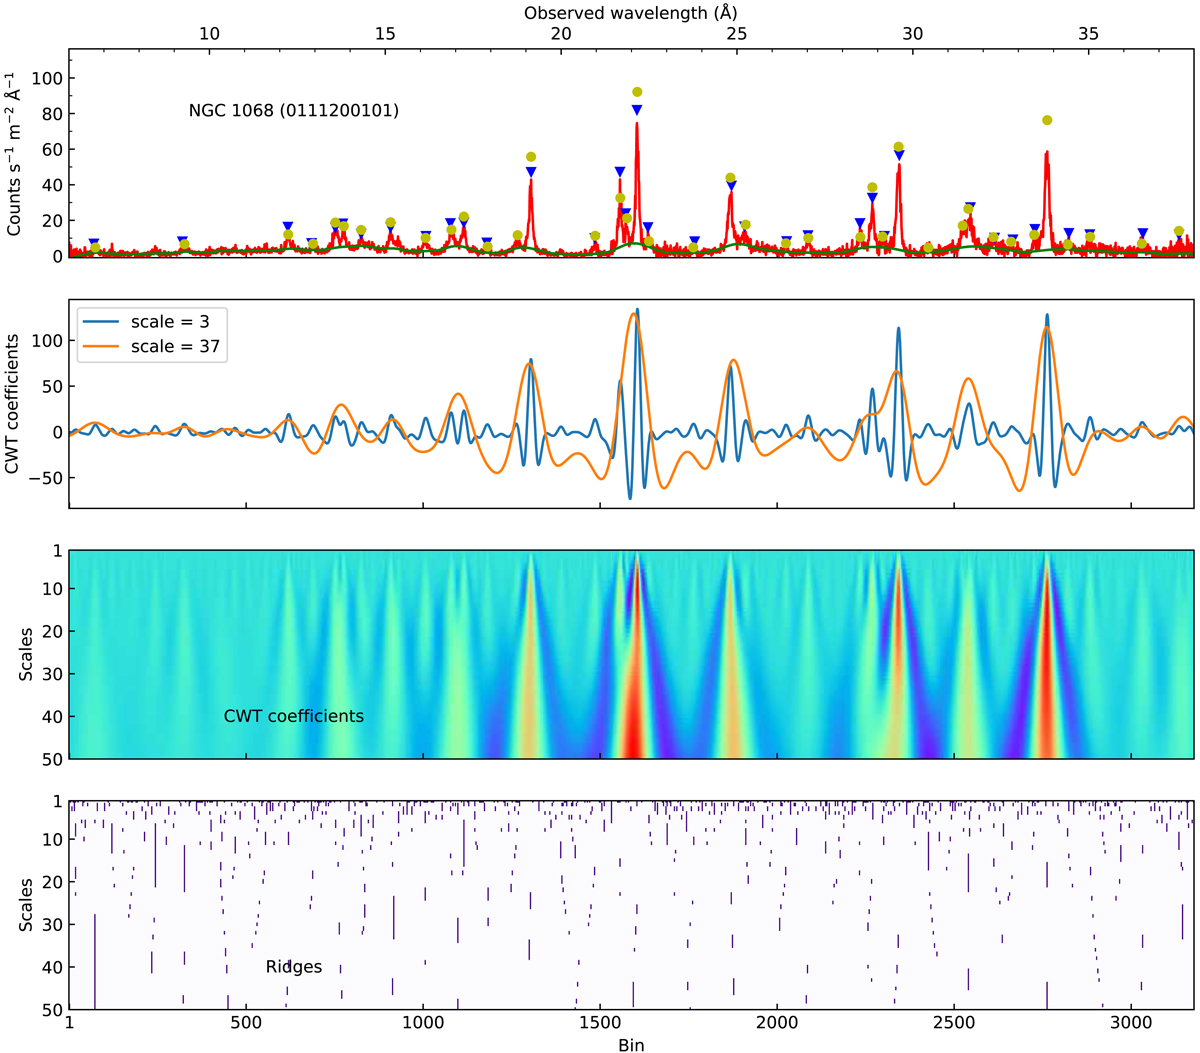
Top panel: observed RGS flux spectrum of NGC 1068 (ObsID: 0111200101). The RGS 1 and RGS 2 spectra (in red) are combined. Error bars are not shown for clarity. The blue triangles mark peaks detected by the MSPD algorithm (Zhang et al. 2015) with (their definition of) signal-to-noise ratio ≥7. The yellow circles mark peaks detected by the present work at a significance level of ≳2.7σ. The estimated continuum in green is based on the asymmetrically reweighted penalized least squares algorithm (arPLS, Baek et al. 2015). The estimated continuum is shown merely for guidance as it is independent of the MSPD algorithm. The second panel gives the coefficients (Y-axis) of the continuous wavelet transform (CWT) of the spectrum at scale = 3 (blue) and 37 (orange). The third panel is a color map of the CWT coefficients at different scales (Y-axis) and at each spectral bin (X-axis). The redder the color, the larger the CWT coefficient. The bottom panel presents the so-called ridges across different scales.
Current usage metrics show cumulative count of Article Views (full-text article views including HTML views, PDF and ePub downloads, according to the available data) and Abstracts Views on Vision4Press platform.
Data correspond to usage on the plateform after 2015. The current usage metrics is available 48-96 hours after online publication and is updated daily on week days.
Initial download of the metrics may take a while.