Free Access
Fig. 3
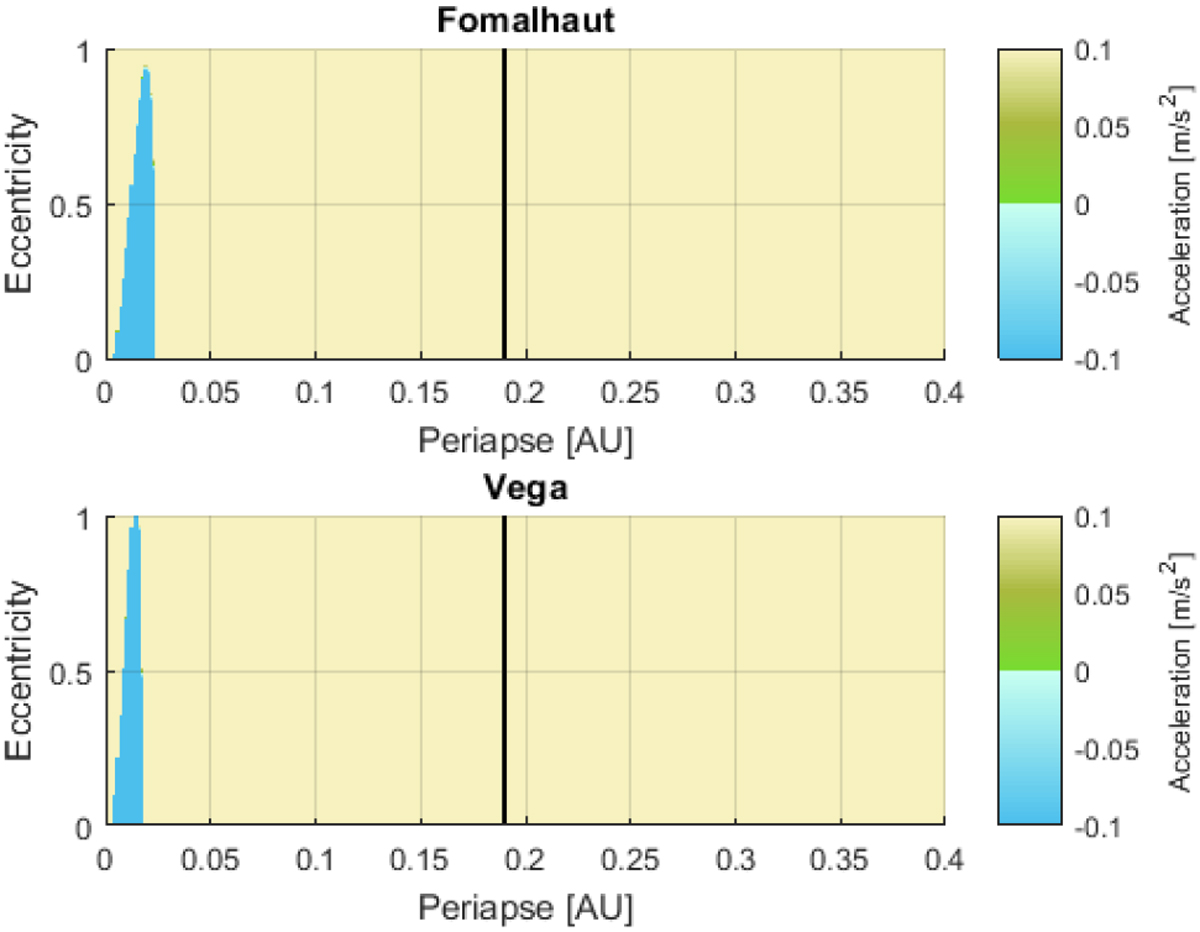
Initial radial acceleration around Fomalhaut (top) and Vega (bottom) averaged over one gyroperiod by usingthe guiding center approximation. The black lines show the Alfvén radius. Both the x- and y-axis in the plot show values of the initial orbit. In order to compare with the situation in Fig. 2b for the Sun, β = 0.1.
Current usage metrics show cumulative count of Article Views (full-text article views including HTML views, PDF and ePub downloads, according to the available data) and Abstracts Views on Vision4Press platform.
Data correspond to usage on the plateform after 2015. The current usage metrics is available 48-96 hours after online publication and is updated daily on week days.
Initial download of the metrics may take a while.