Fig. 1
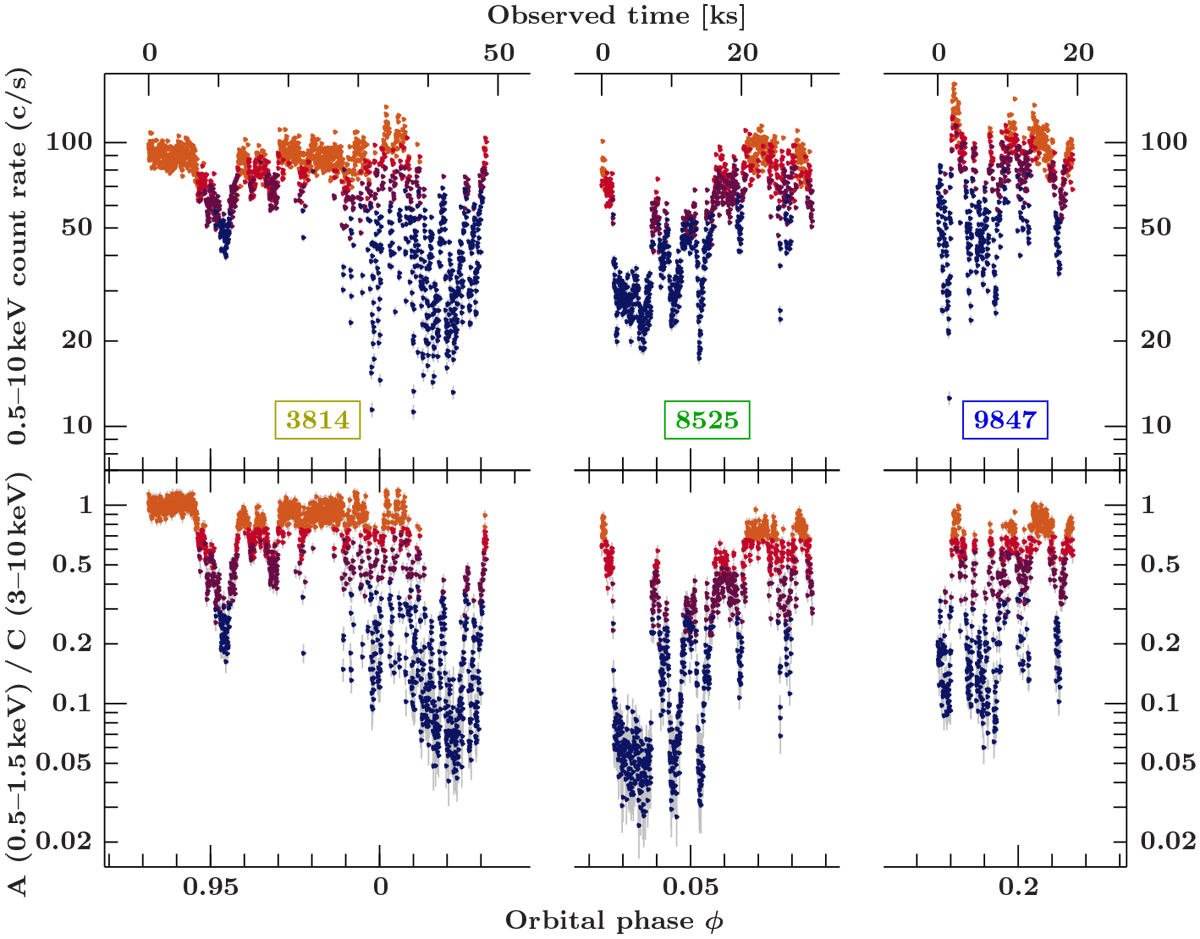
Top panel: light curves with a 25.5 s time resolution of all three observations as a function of orbital phase. Bottom panel: corresponding hardness ratios. All observations were in the low/hard state. Dips are strongest at ϕorb ~ 0.0, become weaker at ϕorb ~ 0.2 and ϕorb ~ 0.75, and completely fade at ϕorb ~ 0.5 (see also Paper II). Colors indicate the selected dipping stages (see right panel of Fig. 3 for the color denotation and Sect. 2.3 for details on the data selection).
Current usage metrics show cumulative count of Article Views (full-text article views including HTML views, PDF and ePub downloads, according to the available data) and Abstracts Views on Vision4Press platform.
Data correspond to usage on the plateform after 2015. The current usage metrics is available 48-96 hours after online publication and is updated daily on week days.
Initial download of the metrics may take a while.