Fig. 13
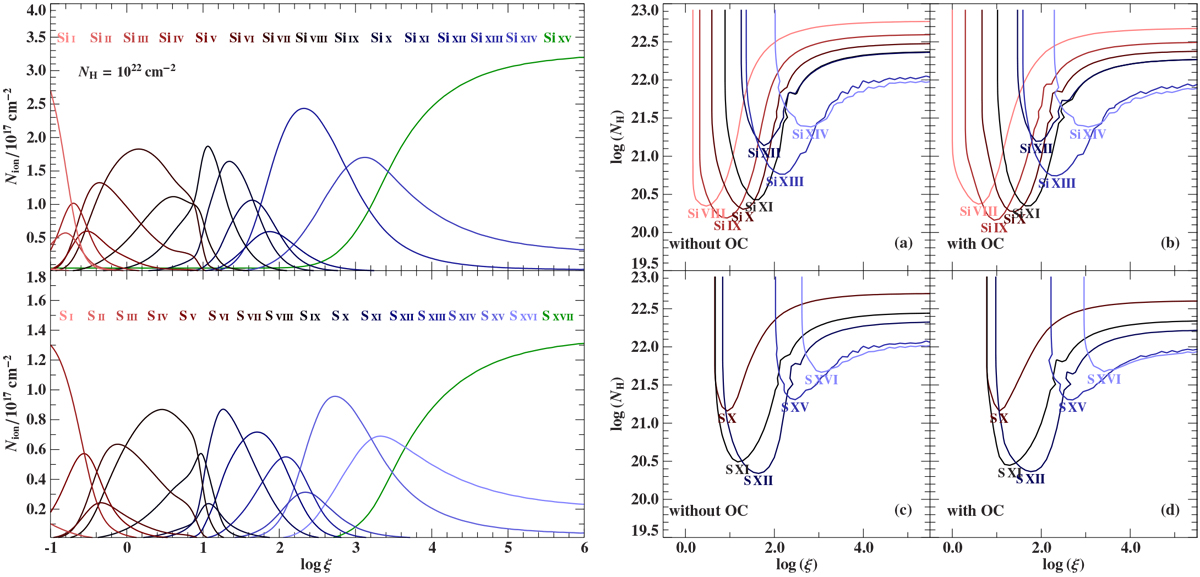
Left panel: predicted columns for the ions of Si and S for a spherical cloud with NH = 1022 cm−2 that is irradiated by a X-ray source with the spectrum defined by Fig. 12. Right panel: lines of constant ion column density color-coded for each different ion of Si (panels a and b) and S (panels c and d), for XSTAR simulated values of equivalent hydrogen column density, NH, and ionization parameter, logξ. The assumed ion columns are the values measured during the strong dip of observation 8525 (Table 5). If a simple XSTAR model described the observation, we would expect these lines to cross in one point (within their error bars). The left column of the figure shows calculations without the effect of the optical companion (OC); the right column includes the UV radiation from the companion.
Current usage metrics show cumulative count of Article Views (full-text article views including HTML views, PDF and ePub downloads, according to the available data) and Abstracts Views on Vision4Press platform.
Data correspond to usage on the plateform after 2015. The current usage metrics is available 48-96 hours after online publication and is updated daily on week days.
Initial download of the metrics may take a while.