Fig. 14
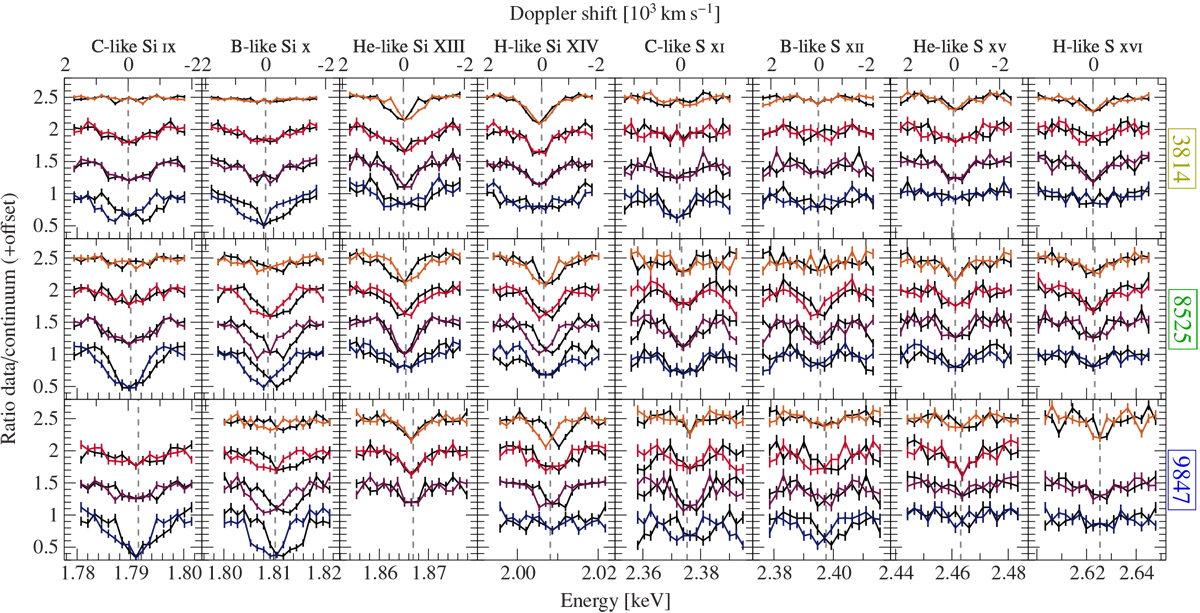
Original line profiles (colored) for the non-dip (top, orange), weak dip (second from top, red), dip (third from top, purple), and strong dip (bottom, blue) lines for selected ions, as well as the same data flipped (black, see also text for further information) at the energy corresponding to adding a constant Doppler shift for each observation (vertical dashed line) to the line’s laboratory energy. For an ideal, symmetric line, the colored and black curves should match. Most of the lines observed have complex line profiles.
Current usage metrics show cumulative count of Article Views (full-text article views including HTML views, PDF and ePub downloads, according to the available data) and Abstracts Views on Vision4Press platform.
Data correspond to usage on the plateform after 2015. The current usage metrics is available 48-96 hours after online publication and is updated daily on week days.
Initial download of the metrics may take a while.