Fig. 3
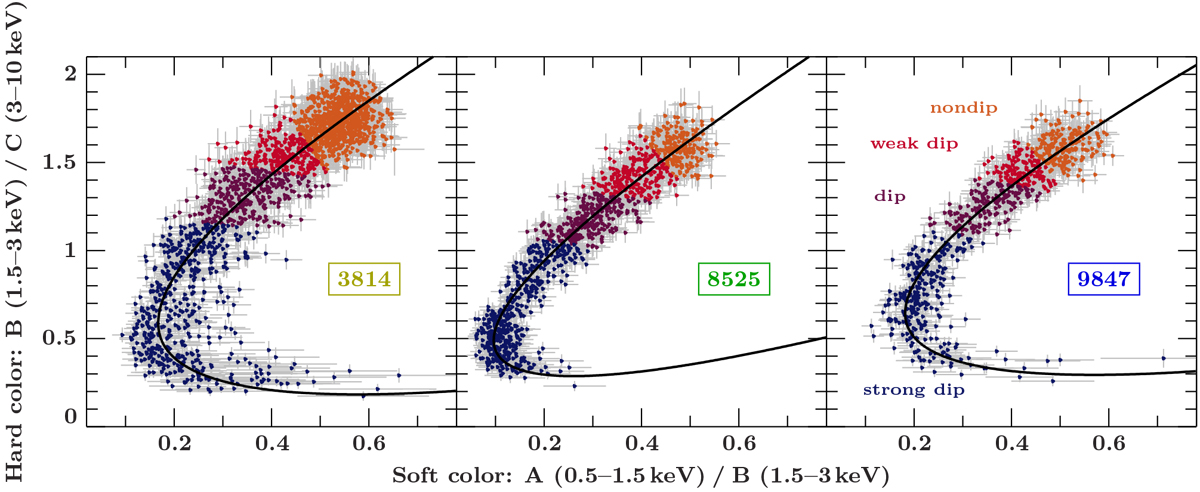
Color–color diagrams for all three observations, showing hardness ratios calculated for soft, intermediate, and hard X-ray bands. As discussed in the text, the observed tracks are determined by absorption: following the track from the top right corner,representing the persistent flux, to the bottom left corner, showing dips, absorption increases and therefore both colors become harder. During the deepest dips, the softer color becomes softer again, while the hard color does not change. Thisbehavior can be explained by partial covering (Sect. 2.2). The spectrum hardens considerably during thesedips. The colors denote the four different dip stages (see right panel). The black line indicates our polynomial fit to the track; see Sect. 2.3 for details.
Current usage metrics show cumulative count of Article Views (full-text article views including HTML views, PDF and ePub downloads, according to the available data) and Abstracts Views on Vision4Press platform.
Data correspond to usage on the plateform after 2015. The current usage metrics is available 48-96 hours after online publication and is updated daily on week days.
Initial download of the metrics may take a while.