Fig. 4
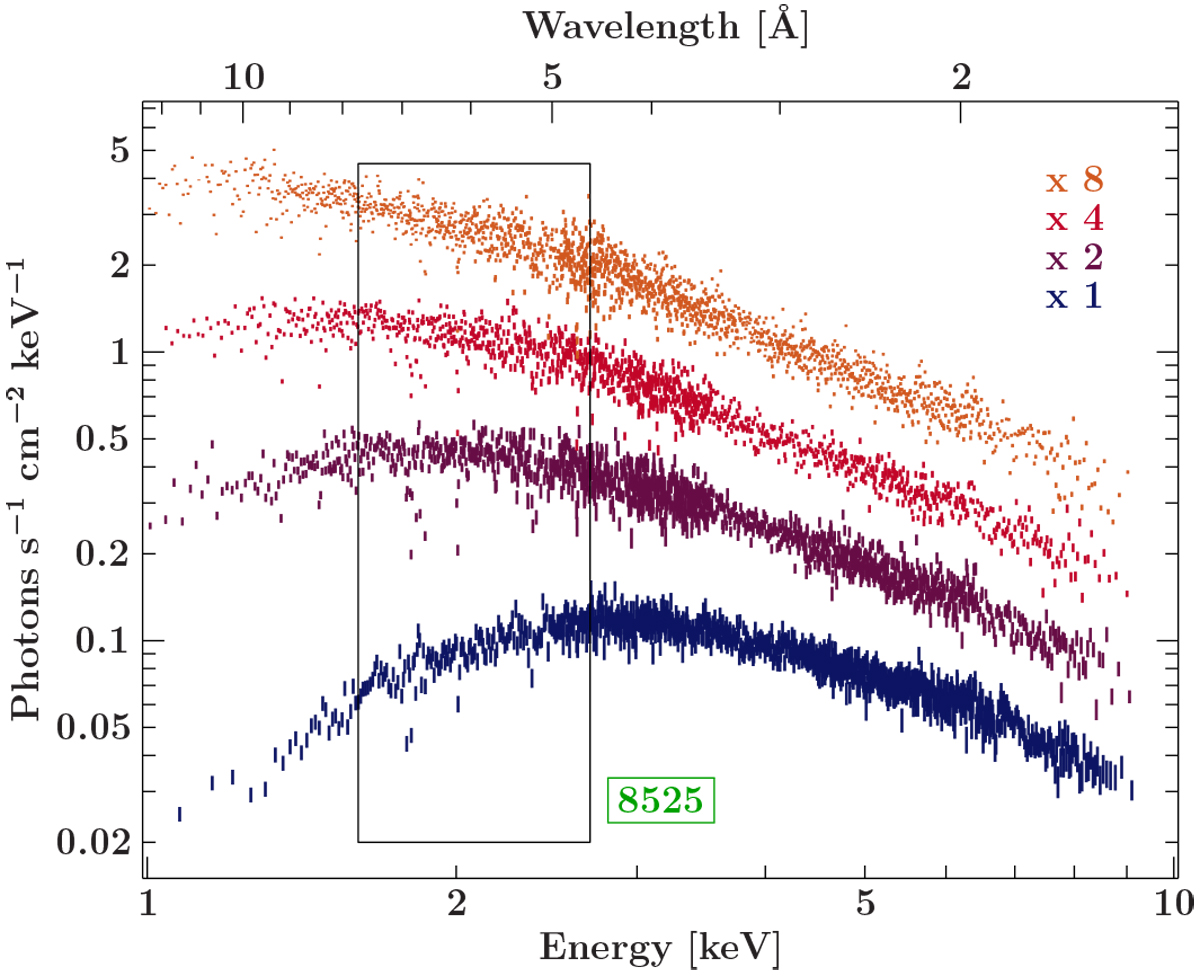
Rebinned HEG spectra of the different dipping stages of ObsID 8525. For clarity, the non-dip spectrum (orange, S/N ≥ 13) is scaled by afactor of 8, the weak dip spectrum (red, S/N ≥ 15) by a factor of 4, and the dip spectrum (violet, S/N ≥ 15) by a factor of 2. The strong dip spectrum (blue, S/N ≥ 17) is not scaled. The box denotes the region containing the Si and S lines. The color scheme is the same as in Figs. 1 and 3.
Current usage metrics show cumulative count of Article Views (full-text article views including HTML views, PDF and ePub downloads, according to the available data) and Abstracts Views on Vision4Press platform.
Data correspond to usage on the plateform after 2015. The current usage metrics is available 48-96 hours after online publication and is updated daily on week days.
Initial download of the metrics may take a while.