Free Access
Fig. 5
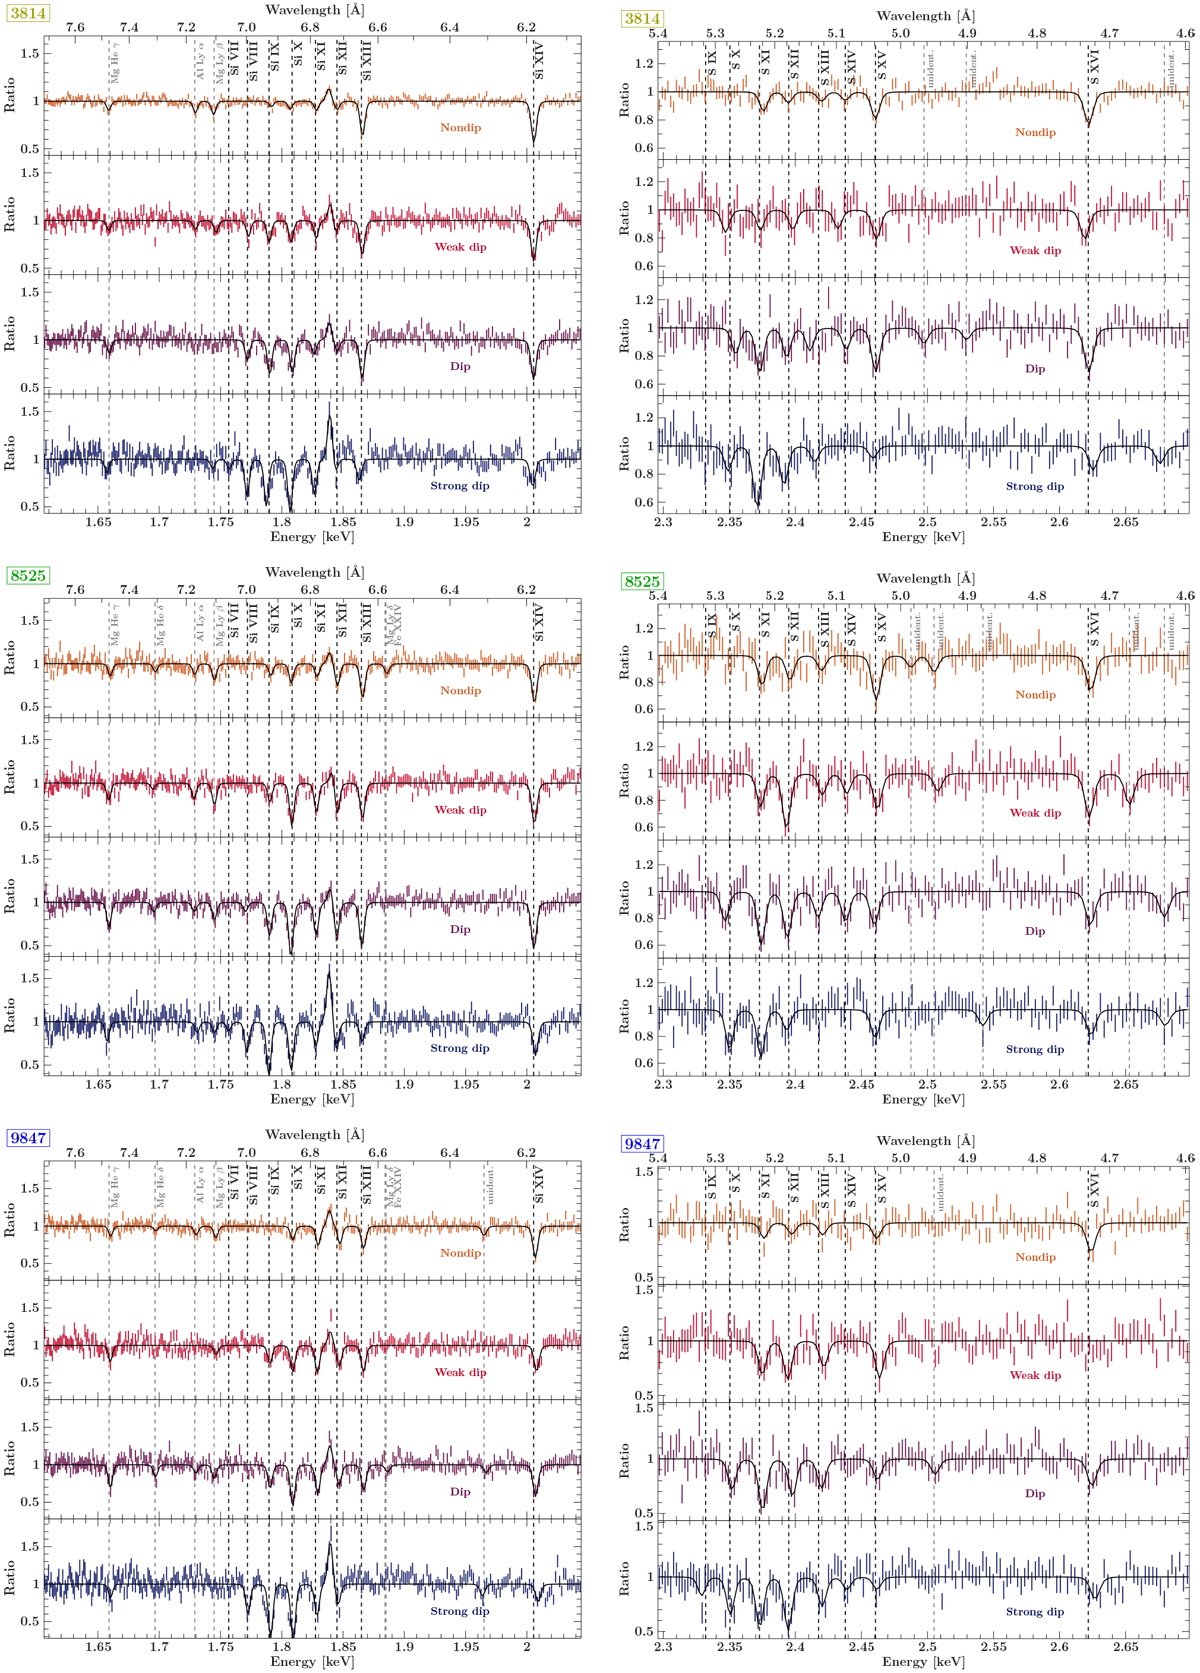
Evolution of silicon (left column) and sulfur (right column) lines with dipping stages for the three observations considered (from top to bottom). The panels show combined HEG and MEG ± 1st spectra relative to their respective continua. The solid black line shows the line fits.
Current usage metrics show cumulative count of Article Views (full-text article views including HTML views, PDF and ePub downloads, according to the available data) and Abstracts Views on Vision4Press platform.
Data correspond to usage on the plateform after 2015. The current usage metrics is available 48-96 hours after online publication and is updated daily on week days.
Initial download of the metrics may take a while.