Fig. 1
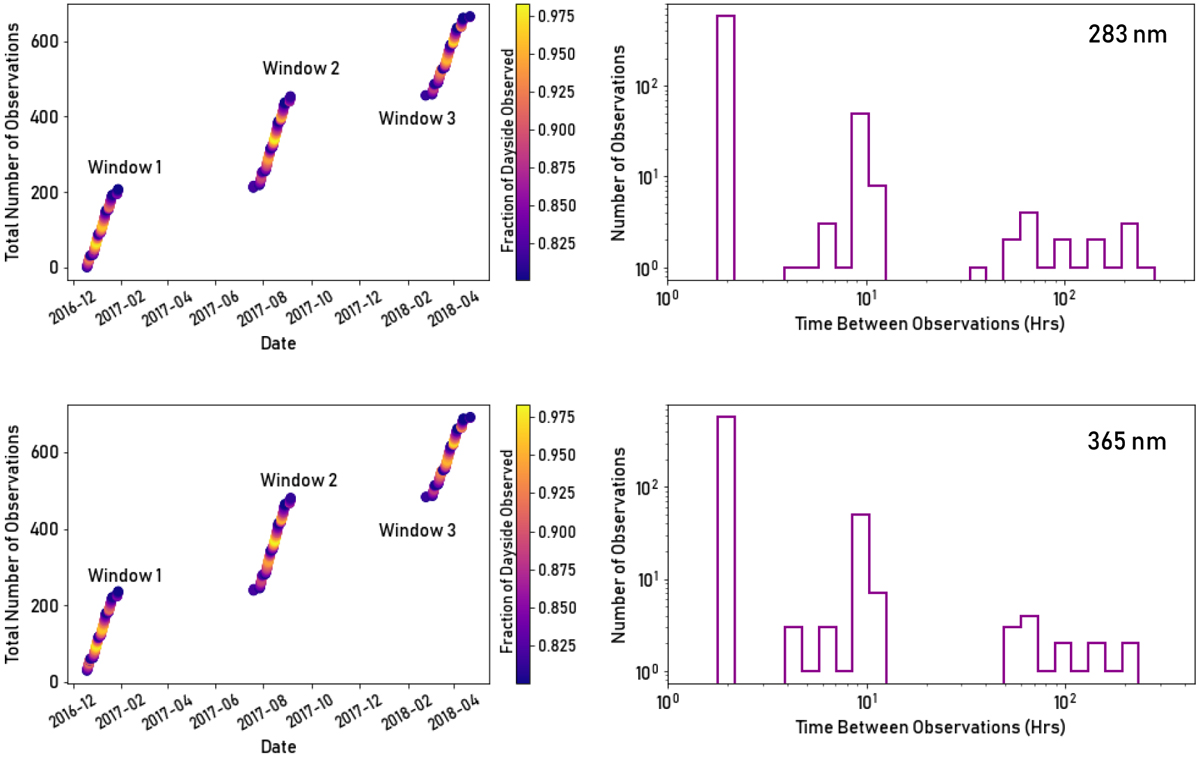
Observation times of the 665 and 652 images used in this study for 283 nm (top left) and 365 nm (bottom left), respectively.The windows consist of 209, 244, and 212 images for 283 nm and 206, 237, and 209 images for 365 nm, respectively.The color of the data point indicates the fraction of the dayside that was observed in that image. Right: histograms showing the time gaps between successive images. The majority of the images are taken at intervals of 2 h, but longer intervals are not uncommon.
Current usage metrics show cumulative count of Article Views (full-text article views including HTML views, PDF and ePub downloads, according to the available data) and Abstracts Views on Vision4Press platform.
Data correspond to usage on the plateform after 2015. The current usage metrics is available 48-96 hours after online publication and is updated daily on week days.
Initial download of the metrics may take a while.