Fig. 3
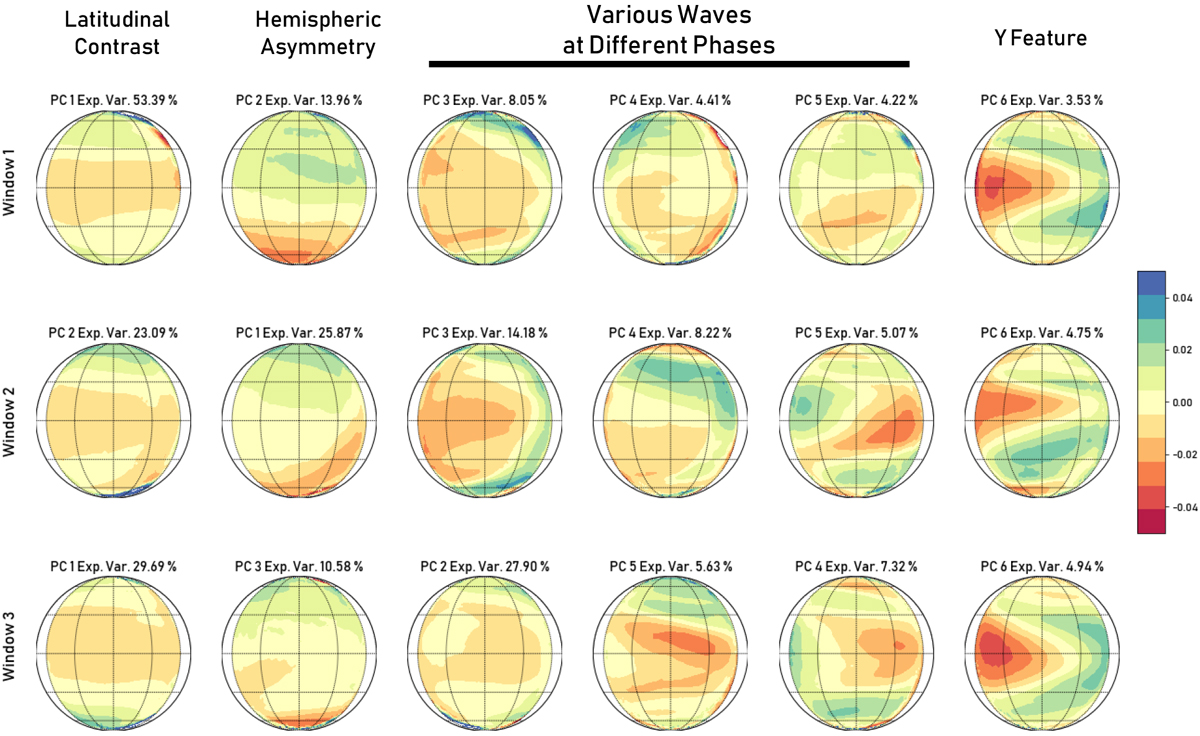
First six modes of variability from the DINEOF interpolated UVI dataset for the three windows at 283 nm. The first row is lined up in order of the PCs, while the second and third are rearranged so that similar patterns line up in the same column. The first mode shows a pattern similar to a Hadley circulation, while the second show a hemispheric oscillation. The third, fourth, and fifth columns appear to show a combination of short period atmospheric waves, while the sixth shows the well known Y-feature.
Current usage metrics show cumulative count of Article Views (full-text article views including HTML views, PDF and ePub downloads, according to the available data) and Abstracts Views on Vision4Press platform.
Data correspond to usage on the plateform after 2015. The current usage metrics is available 48-96 hours after online publication and is updated daily on week days.
Initial download of the metrics may take a while.