Fig. 5
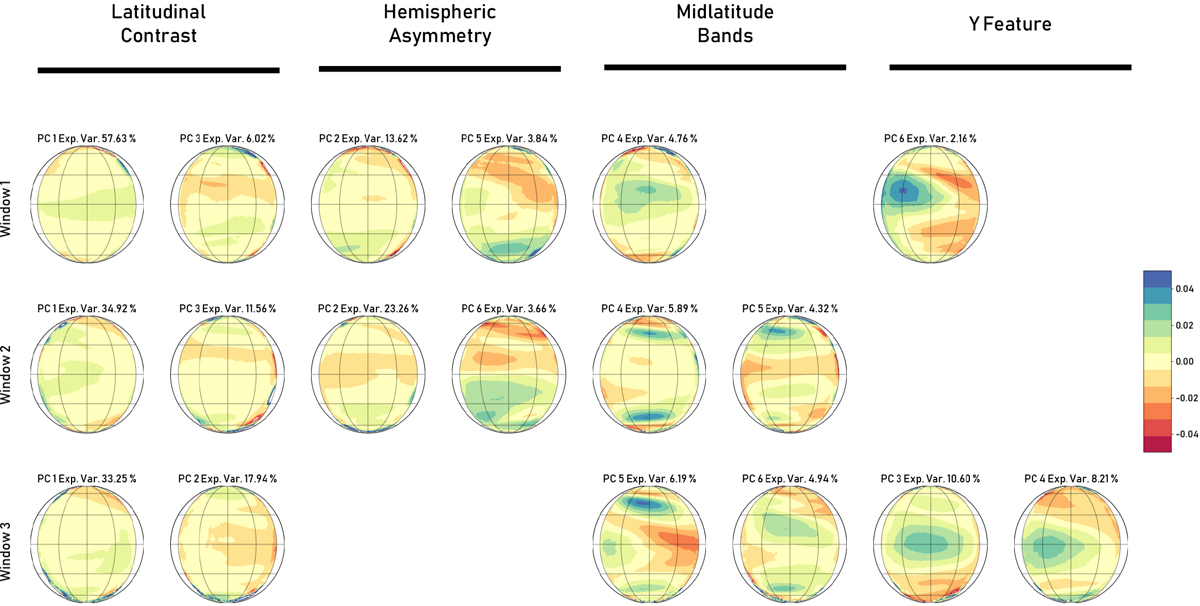
Same as Fig. 3 but for 365 nm. The patterns are much more variable between the windows, but can still be broadly classified into four groups. The first mode shows a pattern similar to a Hadley circulation, while the second shows a hemispheric oscillation. The third and fourth groups show signatures of the midlatitude Rossby waves and Y-feature, respectively. Not all groups are represented in all windows.
Current usage metrics show cumulative count of Article Views (full-text article views including HTML views, PDF and ePub downloads, according to the available data) and Abstracts Views on Vision4Press platform.
Data correspond to usage on the plateform after 2015. The current usage metrics is available 48-96 hours after online publication and is updated daily on week days.
Initial download of the metrics may take a while.