Fig. 1.
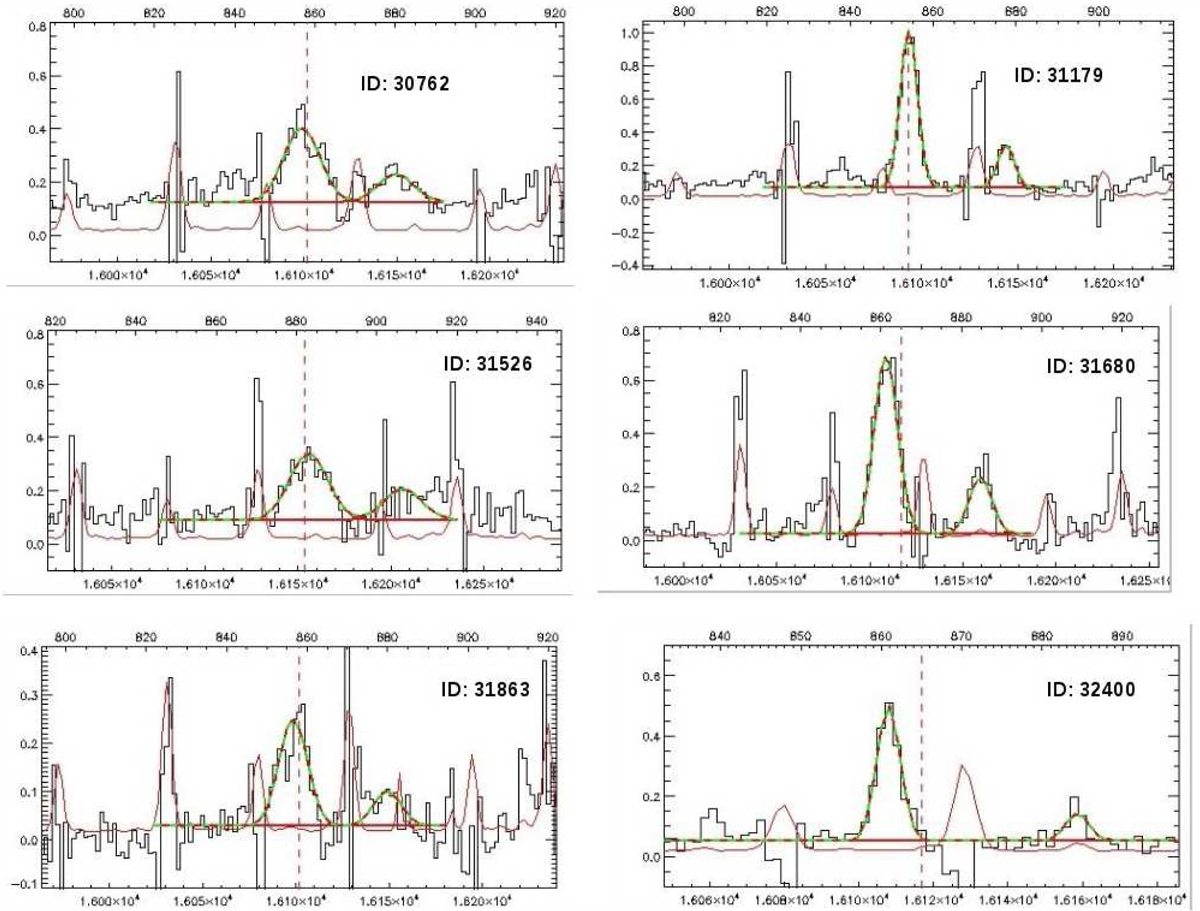
Six galaxies of the main SFvirialized sample. The panels show for each galaxy the extracted spectrum (black solid line) over an area of 25 spaxels with the fitted Gaussians by KUBEVIZ to Hα and [N II] λ 6584 shown in green and the noise spectrum as a solid red line. It can be seen that the measurements of Hα and [N II] λ 6584 are not affected by strong sky lines (peaks of the solid red lines).
Current usage metrics show cumulative count of Article Views (full-text article views including HTML views, PDF and ePub downloads, according to the available data) and Abstracts Views on Vision4Press platform.
Data correspond to usage on the plateform after 2015. The current usage metrics is available 48-96 hours after online publication and is updated daily on week days.
Initial download of the metrics may take a while.