Fig. 2.
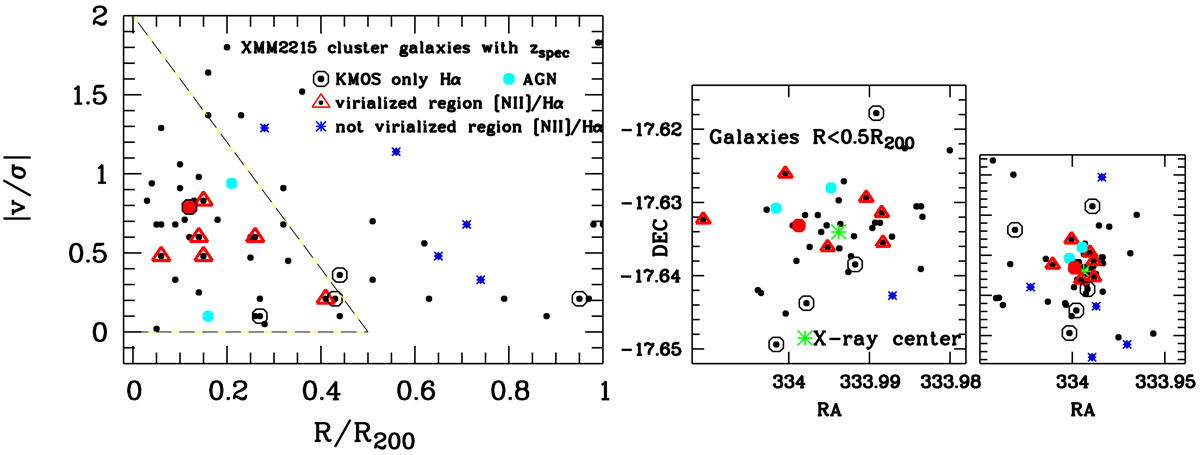
Left: phase-space diagram showing 58 XMM2215 cluster galaxies with spectroscopic redshifts inside R200. The galaxies with KMOS H-band observations are shown by larger symbols, as indicated in the legend. The dashed large triangle in the lower left-hand corner shows the virialized region, as derived by Rhee et al. (2017) using cosmological hydrodynamic simulations of groups and clusters. Center: spatial distribution of 42 galaxies in the central part of the XMM2215 cluster at R < 0.5R200 (symbols like in the left panel). The red filled circle indicates one galaxy with a relatively high [NII]/Hα ratio (but not as high as for the two objects shown in cyan) indicating possible AGN activity. A green star symbol shows the cluster center determined with extended X-ray emission (Stanford et al. 2006). Right: spatial distribution of all 58 cluster galaxies shown in the phase-space diagram (left panel).
Current usage metrics show cumulative count of Article Views (full-text article views including HTML views, PDF and ePub downloads, according to the available data) and Abstracts Views on Vision4Press platform.
Data correspond to usage on the plateform after 2015. The current usage metrics is available 48-96 hours after online publication and is updated daily on week days.
Initial download of the metrics may take a while.